Shorewood: Fire Incidents, Illinois (IL)
Where are fire incidents reported in Shorewood, IL
Something went wrong! Please refresh the page.
| Fire incidents reported | |
|---|---|
| Sreet name | Count |
| JEFFERSON ST | 108 |
| FRONTAGE RD | 100 |
| BROOKFOREST AV | 76 |
| INTERSTATE 55 FWY | 72 |
| RIVER RD | 64 |
| BLACK RD | 56 |
| BROOKFOREST AV. | 46 |
| SEIL RD | 46 |
| FIELDSTONE DR | 44 |
| I-55 | 42 |
| PARKSIDE DR | 40 |
| COTTAGE ST | 38 |
| RT. 59 | 38 |
| BROOKFOREST AVE | 32 |
| INTERSTATE 80 FWY | 26 |
| WYNSTONE DR | 22 |
| MOUND RD | 20 |
| BURR RIDGE DR | 18 |
| SUMMIT CREEK DR | 18 |
| BROOKFOREST | 16 |
| BROOKSHORE DR | 16 |
| RAVEN RD | 16 |
| RAVINIA DR | 16 |
| AUGUSTA LN | 14 |
| COUNTY LINE RD | 14 |
| GENEVA ST | 14 |
| PARK RIVER LN | 14 |
| PARKSHORE DR | 14 |
| EARL RD | 12 |
| FRANK DR | 12 |
2002 - 2018 National Fire Incident Reporting System (NFIRS) incidents
- Incident types reported to NFIRS in Shorewood, IL
- 8,18155.9%Rescue & EMS
- 1,87412.8%Hazardous Condition
- 1,3809.4%Good Intent Call
- 1,1838.1%Service Call
- 1,0176.9%False Alarm
- 9786.7%Fire
- 160.1%Special Incident
- Fire incident types reported to NFIRS in Shorewood, IL
- 37438.2%Outside Fires
- 36737.5%Structure Fires
- 18518.9%Mobile Property/Vehicle Fires
- 525.3%Other
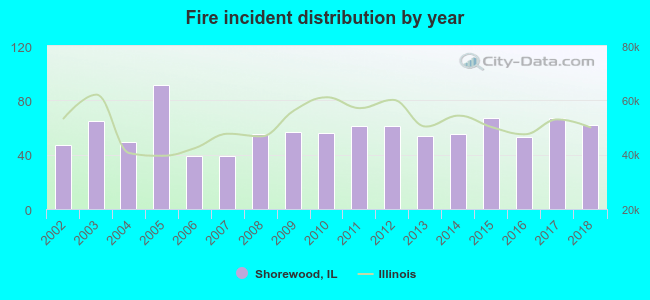 Based on the data from the years 2002 - 2018 the average number of fire incidents per year is 58. The highest number of fires - 91 took place in 2005, and the least - 39 in 2006. The data has an increasing trend.
The average number of yearly fire incidents per 10k residents in Shorewood, IL compared to nearest cities:
(Note: Based on data for the last 3 years, including only cities with population 5,000 and above)
| Shorewood: | 36.6 |
| Minooka: | 54.8 |
| Joliet: | 28.1 |
| Channahon: | 43.1 |
| Crest Hill: | 23.6 |
| Plainfield: | 40.4 |
| Lockport: | 43.1 |
| Romeoville: | 31.3 |
| New Lenox: | 36.1 |
 The median response time based on all reported fire incidents is 5 minutes. This is close to the Illinois median value.
The median response time in Shorewood, IL compared to nearest cities:
(Note: Based on data for all years, including only cities with at least 500 fire incidents)
| Shorewood: | 5 minutes |
| Minooka: | 7 minutes |
| Joliet: | 5 minutes |
| Channahon: | 7 minutes |
| Crest Hill: | 5 minutes |
| Plainfield: | 6 minutes |
| Elwood: | 7 minutes |
| Lockport: | 5 minutes |
| Romeoville: | 5 minutes |
 According to the data from the years 2002 - 2018 the average number of fire-related casualties per year is 0. The highest number of injuries - 4 took place in 2011, and the lowest - 0 in 2002. The data has a constant trend.
The average number of casualties per 1,000 fires is 7. This indicator was the highest - 66 in 2011, and the lowest 0 in 2002. The trend for casualties per 1,000 incidents is decreasing. Compared to the state value the number of casualties per 1,000 incidents is lower.
According to the data from the years 2002 - 2018 the average number of fire-related casualties per year is 0. The highest number of injuries - 4 took place in 2011, and the lowest - 0 in 2002. The data has a constant trend.
The average number of casualties per 1,000 fires is 7. This indicator was the highest - 66 in 2011, and the lowest 0 in 2002. The trend for casualties per 1,000 incidents is decreasing. Compared to the state value the number of casualties per 1,000 incidents is lower.Casualties per 1,000 incidents in Shorewood, IL compared to nearest cities:
(Note: Based on data for all years, including only cities with at least 500 fire incidents)
| Shorewood: | 7.2 |
| Minooka: | 6.3 |
| Joliet: | 4.2 |
| Channahon: | 1.1 |
| Crest Hill: | 11.5 |
| Plainfield: | 8.0 |
| Elwood: | 1.7 |
| Lockport: | 16.0 |
| Romeoville: | 12.2 |
 28.1% incidents where reported in the morning and 71.9% in the evening. The most fires (16.5%) took place on Monday, and the least (9.3%) on Wednesday.
 Based on the 978 incident reports from years 2002 - 2018 most fires (12.2%) took place during April, and the least (5.7%) in February.
 Out of all 14,645 cases reported during the years 2002 - 2018, the most belonged to the categories: Rescue & EMS (55.9%), Hazardous Condition (12.8%), and Good Intent Call (9.4%).
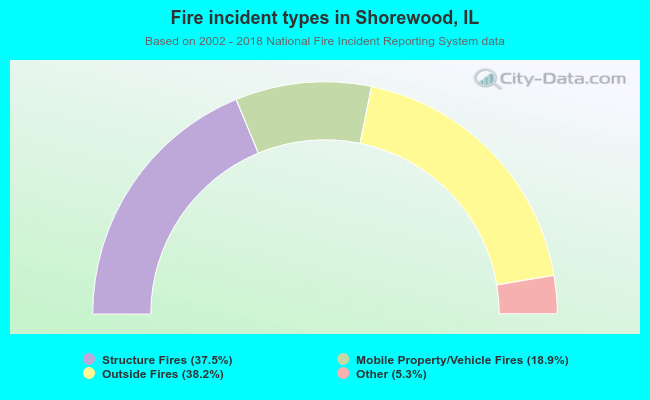 When looking into fire subcategories, the most reports belonged to: Outside Fires (38.2%), and Structure Fires (37.5%).