Lockport: Fire Incidents, Illinois (IL)
Where are fire incidents reported in Lockport, IL
Something went wrong! Please refresh the page.
| Fire incidents reported | |
|---|---|
| Sreet name | Count |
| STATE ST | 316 |
| 9TH ST | 156 |
| OAK AVE | 124 |
| FARRELL RD | 112 |
| BRUCE RD | 106 |
| ARCHER AVE | 96 |
| 159TH ST | 82 |
| STATE | 64 |
| DIVISION ST | 60 |
| 159TH | 50 |
| HIGH RD | 50 |
| WASHINGTON ST | 50 |
| BRIGGS ST | 44 |
| GOUGAR RD | 42 |
| JEFFERSON ST | 40 |
| CANAL ST | 32 |
| HIGHLAND AVE | 32 |
| MCCAMERON AVE | 30 |
| NEW AVE | 30 |
| WEBER RD | 30 |
| ARTHUR AVE | 28 |
| DELLWOOD AVE | 28 |
| RENWICK RD | 28 |
| 13TH ST | 26 |
| 147TH PL | 26 |
| 7TH ST | 26 |
| GREEN GARDEN PL | 26 |
| PRINCETON AVE | 26 |
| 151ST ST | 24 |
| AIRPORT RD | 24 |
| Other | 569 |
2002 - 2018 National Fire Incident Reporting System (NFIRS) incidents
- Incident types reported to NFIRS in Lockport, IL
- 11,34053.7%Rescue & EMS
- 2,37711.3%Fire
- 2,27010.7%False Alarm
- 2,12010.0%Hazardous Condition
- 1,7588.3%Service Call
- 1,1735.6%Good Intent Call
- 330.2%Special Incident
- 320.2%Severe Weather
- Fire incident types reported to NFIRS in Lockport, IL
- 97541.0%Structure Fires
- 92739.0%Outside Fires
- 34614.6%Mobile Property/Vehicle Fires
- 1295.4%Other
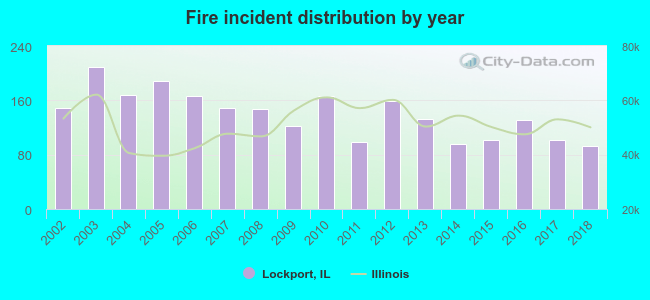 According to the data from the years 2002 - 2018 the average number of fire incidents per year is 140. The highest number of fire incidents - 209 took place in 2003, and the least - 93 in 2018. The data has a dropping trend.
The average number of yearly fire incidents per 10k residents in Lockport, IL compared to nearest cities:
(Note: Based on data for the last 3 years, including only cities with population 5,000 and above)
| Lockport: | 43.1 |
| Crest Hill: | 23.6 |
| Romeoville: | 31.3 |
| Joliet: | 28.1 |
| Homer Glen: | 31.7 |
| Lemont: | 40.6 |
| New Lenox: | 36.1 |
| Bolingbrook: | 23.8 |
| Plainfield: | 40.4 |
 The median response time based on all reported fire incidents is 5 minutes. This is close to the state median value.
The median response time in Lockport, IL compared to nearest cities:
(Note: Based on data for all years, including only cities with at least 500 fire incidents)
| Lockport: | 5 minutes |
| Crest Hill: | 5 minutes |
| Romeoville: | 5 minutes |
| Joliet: | 5 minutes |
| Homer Glen: | 6 minutes |
| Lemont: | 7 minutes |
| New Lenox: | 6 minutes |
| Bolingbrook: | 5 minutes |
| Plainfield: | 6 minutes |
 Based on the reports from the years 2002 - 2018 the average number of fire-related casualties per year is 2. The highest number of reported casualties - 18 took place in 2003, and the lowest - 0 in 2002. The data has a constant trend.
The average number of casualties per 1,000 fires is 13. This indicator was the highest - 86 in 2003, and the lowest 0 in 2002. The trend for casualties per 1,000 fire incidents is constant. Compared to the state value the number of casualties per 1,000 fire incidents is higher.
Based on the reports from the years 2002 - 2018 the average number of fire-related casualties per year is 2. The highest number of reported casualties - 18 took place in 2003, and the lowest - 0 in 2002. The data has a constant trend.
The average number of casualties per 1,000 fires is 13. This indicator was the highest - 86 in 2003, and the lowest 0 in 2002. The trend for casualties per 1,000 fire incidents is constant. Compared to the state value the number of casualties per 1,000 fire incidents is higher.Casualties per 1,000 incidents in Lockport, IL compared to nearest cities:
(Note: Based on data for all years, including only cities with at least 500 fire incidents)
| Lockport: | 16.0 |
| Crest Hill: | 11.5 |
| Romeoville: | 12.2 |
| Joliet: | 4.2 |
| Homer Glen: | 8.4 |
| Lemont: | 8.4 |
| New Lenox: | 3.6 |
| Bolingbrook: | 20.8 |
| Plainfield: | 8.0 |
 33.7% incidents where reported in the morning and 66.3% in the evening. The most fires (16.7%) took place on Sunday, and the least (12.8%) on Friday.
 According to the 2,377 incident reports from years 2002 - 2018 most fires (10.4%) took place during November, and the least (4.9%) in February.
 Out of all 21,123 cases reported during the years 2002 - 2018, the most belonged to the categories: Rescue & EMS (53.7%), Fire (11.3%), and False Alarm (10.7%).
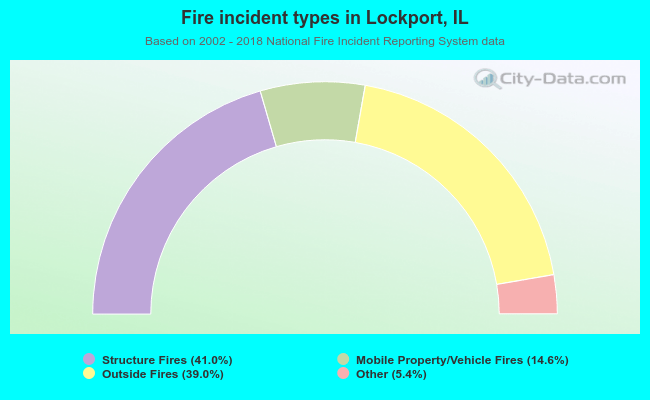 When looking into fire subcategories, the most incidents belonged to: Structure Fires (41.0%), and Outside Fires (39.0%).