Scottsboro: Fire Incidents, Alabama (AL)
Where are fire incidents reported in Scottsboro, AL
Something went wrong! Please refresh the page.
| Fire incidents reported | |
|---|---|
| Sreet name | Count |
| BROAD ST | 262 |
| WILLOW ST | 258 |
| HIGHWAY 35 | 249 |
| HIGHWAY 79 | 214 |
| JOHN T REID PKY | 174 |
| HIGHWAY 72 | 143 |
| COUNTY ROAD 21 | 136 |
| VETERANS DR | 133 |
| WOODS COVE RD | 105 |
| COUNTY ROAD 17 | 94 |
| ANDERSON ST | 91 |
| COUNTY PARK RD | 91 |
| OLD LARKINSVILLE RD | 79 |
| COUNTY ROAD 30 | 75 |
| HOUSTON ST | 73 |
| BOB JONES RD | 72 |
| SNODGRASS RD | 68 |
| RIDGEDALE RD | 67 |
| CLEMONS RD | 63 |
| MOODY RIDGE RD | 61 |
| TUPELO PIKE | 56 |
| STEWART RD | 52 |
| AL HWY 79 | 51 |
| LONGHOLLOW RD | 51 |
| COUNTY ROAD 28 | 49 |
| SWEARENGIN RD | 47 |
| ED HEMBREE DR | 46 |
| 35 HWY | 43 |
| EDMONDS DR | 43 |
| COUNTY ROAD 531 | 41 |
2003 - 2018 National Fire Incident Reporting System (NFIRS) incidents
- Incident types reported to NFIRS in Scottsboro, AL
- 5,48455.0%Rescue & EMS
- 1,52715.3%Fire
- 1,21812.2%Good Intent Call
- 9919.9%Service Call
- 4184.2%Hazardous Condition
- 3063.1%False Alarm
- 150.2%Severe Weather
- Fire incident types reported to NFIRS in Scottsboro, AL
- 66143.3%Outside Fires
- 49832.6%Structure Fires
- 29219.1%Mobile Property/Vehicle Fires
- 765.0%Other
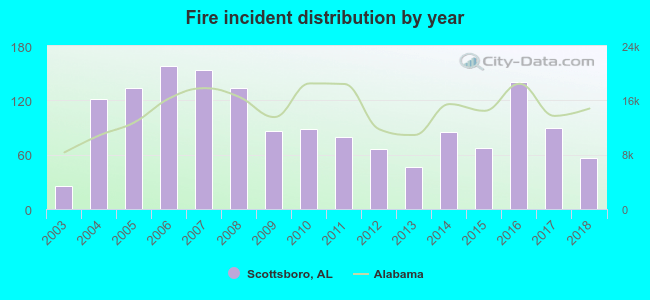 According to the data from the years 2003 - 2018 the average number of fires per year is 95. The highest number of reported fires - 158 took place in 2006, and the least - 25 in 2003. The data has an increasing trend.
The average number of yearly fire incidents per 10k residents in Scottsboro, AL compared to nearest cities:
(Note: Based on data for the last 3 years, including only cities with population 5,000 and above)
| Scottsboro: | 64.4 |
| Rainsville: | 89.8 |
| Fort Payne: | 42.0 |
| Guntersville: | 119.2 |
| Albertville: | 115.0 |
| Boaz: | 86.4 |
| Huntsville: | 42.6 |
| Meridianville: | 14.9 |
| Arab: | 62.0 |
 The median response time based on all reported fire incidents is 5 minutes. This is lower compared to the state median value.
The median response time in Scottsboro, AL compared to nearest cities:
(Note: Based on data for all years, including only cities with at least 500 fire incidents)
| Scottsboro: | 5 minutes |
| Fort Payne: | 5 minutes |
| Guntersville: | 6 minutes |
| Albertville: | 5 minutes |
| Boaz: | 6 minutes |
| Huntsville: | 5 minutes |
| Arab: | 7 minutes |
| Gaylesville: | 10 minutes |
 According to the reports from the years 2003 - 2018 the average number of fire-related yearly casualties is 1. The highest number of casualties - 4 took place in 2006, and the lowest - 0 in 2004. The data has a dropping trend.
The average number of injuries per 1,000 fire incidents is 14. This indicator was the highest - 61 in 2012, and the lowest 0 in 2004. The trend for injuries per 1,000 incidents is declining. Compared to the Alabama value the number of injuries per 1,000 incidents is much higher.
According to the reports from the years 2003 - 2018 the average number of fire-related yearly casualties is 1. The highest number of casualties - 4 took place in 2006, and the lowest - 0 in 2004. The data has a dropping trend.
The average number of injuries per 1,000 fire incidents is 14. This indicator was the highest - 61 in 2012, and the lowest 0 in 2004. The trend for injuries per 1,000 incidents is declining. Compared to the Alabama value the number of injuries per 1,000 incidents is much higher.Casualties per 1,000 incidents in Scottsboro, AL compared to nearest cities:
(Note: Based on data for all years, including only cities with at least 500 fire incidents)
| Scottsboro: | 11.8 |
| Fort Payne: | 9.5 |
| Guntersville: | 3.8 |
| Albertville: | 0.0 |
| Boaz: | 1.3 |
| Huntsville: | 15.6 |
| Arab: | 1.3 |
| Gaylesville: | 1.4 |
 28.0% incidents where reported in the morning and 72.0% in the evening. The most fires (16.4%) took place on Saturday, and the least (12.4%) on Sunday.
 According to the 1,527 incident reports from years 2003 - 2018 most fires (10.2%) took place during July, and the least (6.6%) in August.
 Out of all 9,972 cases reported during the years 2003 - 2018, the most belonged to the categories: Rescue & EMS (55.0%), Fire (15.3%), and Good Intent Call (12.2%).
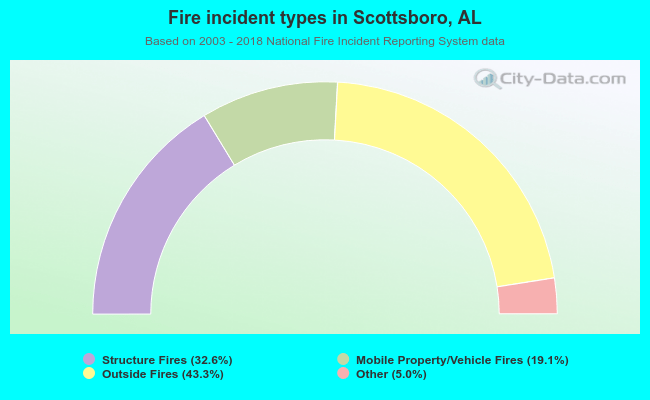 When looking into fire subcategories, the most incidents belonged to: Outside Fires (43.3%), and Structure Fires (32.6%).