Fort Payne: Fire Incidents, Alabama (AL)
Where are fire incidents reported in Fort Payne, AL
Something went wrong! Please refresh the page.
| Fire incidents reported | |
|---|---|
| Sreet name | Count |
| GAULT AVE | 444 |
| GLENN BLVD | 209 |
| GODFREY AVE | 161 |
| I59 FWY | 145 |
| GRAND AVE | 142 |
| I-59 FWY | 124 |
| GREENHILL BLVD | 121 |
| FOREST AVE | 120 |
| ALABAMA AVE | 119 |
| WALLACE AVE | 108 |
| AIRPORT RD | 93 |
| WILLIAMS AVE | 80 |
| DESOTO PKY | 77 |
| SEQUOYAH DR | 71 |
| CLARK AVE | 68 |
| JENNINGS RD | 65 |
| FRUIT FARM RD | 59 |
| HOWELL DR | 59 |
| SANDERS AVE | 58 |
| BRIARWOOD AVE | 54 |
| 45TH ST | 52 |
| 8TH ST | 46 |
| WATKINS AVE | 46 |
| HOUSTON LOOP RD | 45 |
| LINCOLN AVE | 43 |
| ADAMSBURG RD | 42 |
| DOGTOWN RD | 42 |
| 3RD ST | 41 |
| DEAN RD | 37 |
| LEBANON RD | 37 |
2002 - 2018 National Fire Incident Reporting System (NFIRS) incidents
- Incident types reported to NFIRS in Fort Payne, AL
- 5,26871.3%Rescue & EMS
- 1,16015.7%Fire
- 3995.4%False Alarm
- 2563.5%Good Intent Call
- 1882.5%Hazardous Condition
- 911.2%Service Call
- 230.3%Special Incident
- Fire incident types reported to NFIRS in Fort Payne, AL
- 49742.8%Outside Fires
- 33829.1%Structure Fires
- 20217.4%Mobile Property/Vehicle Fires
- 12310.6%Other
 Based on the data from the years 2002 - 2018 the average number of fire incidents per year is 68. The highest number of reported fire incidents - 167 took place in 2006, and the least - 8 in 2008. The data has an increasing trend.
The average number of yearly fire incidents per 10k residents in Fort Payne, AL compared to nearest cities:
(Note: Based on data for the last 3 years, including only cities with population 5,000 and above)
| Fort Payne: | 42.0 |
| Rainsville: | 89.8 |
| Scottsboro: | 64.4 |
| Boaz: | 86.4 |
| Albertville: | 115.0 |
| Guntersville: | 119.2 |
| Gadsden: | 58.5 |
| Glencoe: | 85.7 |
| Attalla: | 42.6 |
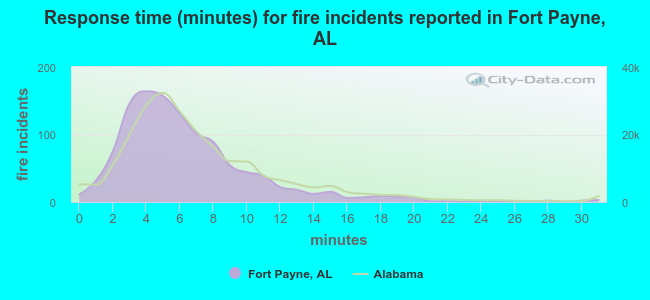 The median response time based on all reported fire incidents is 5 minutes. This is lower than the Alabama median value.
The median response time in Fort Payne, AL compared to nearest cities:
(Note: Based on data for all years, including only cities with at least 500 fire incidents)
| Fort Payne: | 5 minutes |
| Gaylesville: | 10 minutes |
| Cedar Bluff: | 11 minutes |
| Centre: | 11 minutes |
| Scottsboro: | 5 minutes |
| Boaz: | 6 minutes |
| Albertville: | 5 minutes |
| Guntersville: | 6 minutes |
| Gadsden: | 5 minutes |
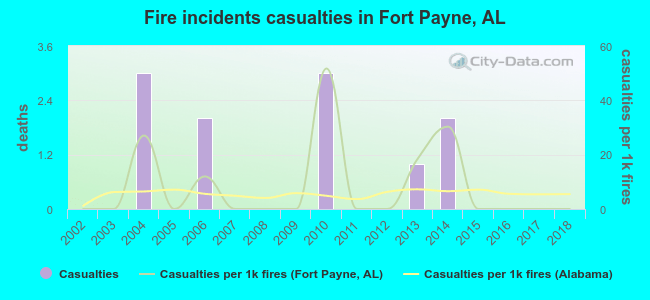 Based on the reports from the years 2002 - 2018 the average number of fire-related yearly casualties is 1. The highest number of casualties - 3 took place in 2004, and the lowest - 0 in 2002. The data has a constant trend.
The average number of casualties per 1,000 fires is 8. This indicator was the highest - 52 in 2010, and the lowest 0 in 2002. The trend for casualties per 1,000 fire incidents is constant. Compared to the Alabama value the number of injuries per 1,000 fire incidents is higher.
Based on the reports from the years 2002 - 2018 the average number of fire-related yearly casualties is 1. The highest number of casualties - 3 took place in 2004, and the lowest - 0 in 2002. The data has a constant trend.
The average number of casualties per 1,000 fires is 8. This indicator was the highest - 52 in 2010, and the lowest 0 in 2002. The trend for casualties per 1,000 fire incidents is constant. Compared to the Alabama value the number of injuries per 1,000 fire incidents is higher.Casualties per 1,000 incidents in Fort Payne, AL compared to nearest cities:
(Note: Based on data for all years, including only cities with at least 500 fire incidents)
| Fort Payne: | 9.5 |
| Gaylesville: | 1.4 |
| Cedar Bluff: | 2.0 |
| Centre: | 0.0 |
| Scottsboro: | 11.8 |
| Boaz: | 1.3 |
| Albertville: | 0.0 |
| Guntersville: | 3.8 |
| Gadsden: | 5.0 |
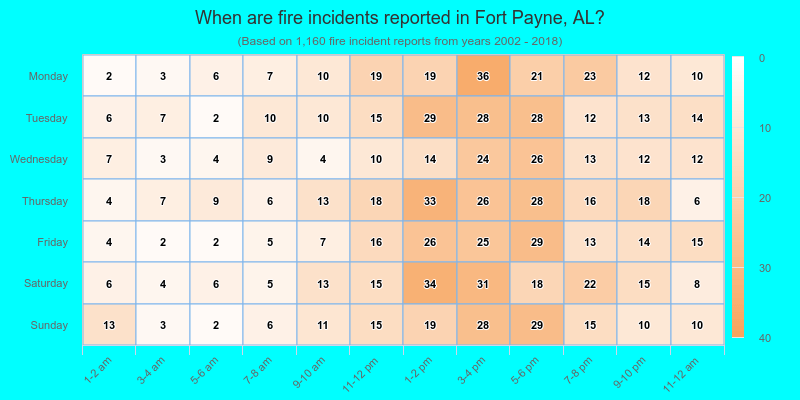
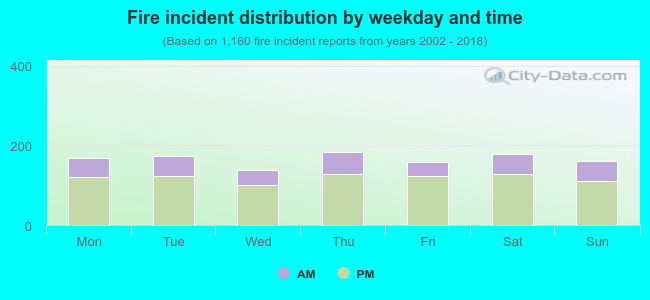 28.1% incidents where reported in the morning and 71.9% in the evening. The most fires (15.9%) took place on Thursday, and the least (11.9%) on Wednesday.
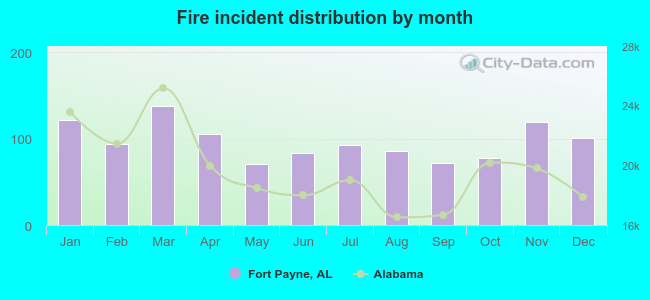 Based on the 1,160 fire incidents from years 2002 - 2018 most fires (11.9%) took place during March, and the least (6.0%) in May.
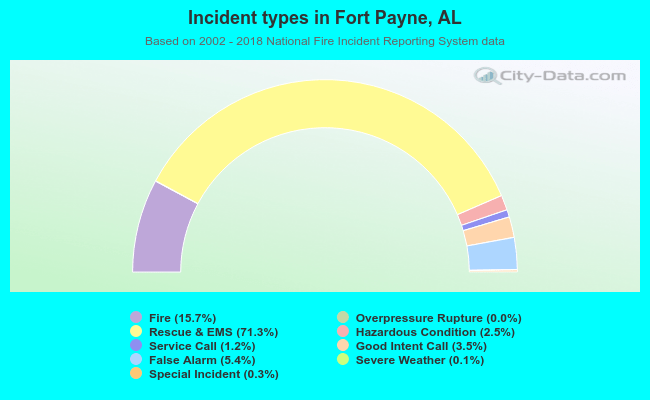 Out of all 7,392 cases reported during the years 2002 - 2018, the most belonged to the categories: Rescue & EMS (71.3%), Fire (15.7%), and False Alarm (5.4%).
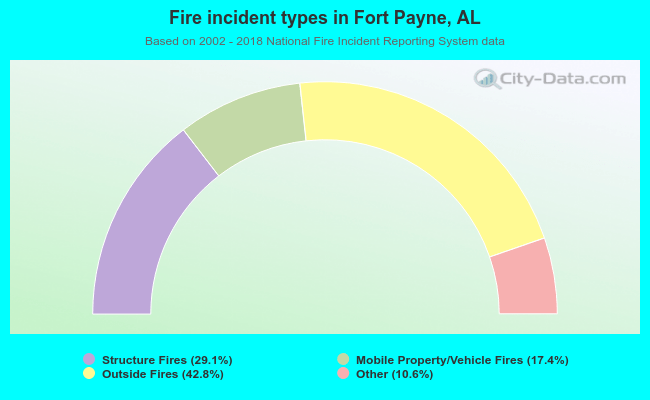 When looking into fire subcategories, the most reports belonged to: Outside Fires (42.8%), and Structure Fires (29.1%).