Roseburg: Fire Incidents, Oregon (OR)
Where are fire incidents reported in Roseburg, OR
Something went wrong! Please refresh the page.
| Fire incidents reported | |
|---|---|
| Sreet name | Count |
| STEPHENS ST | 356 |
| GARDEN VALLEY BLVD | 264 |
| HARVARD AVE | 180 |
| DOUGLAS AVE | 116 |
| HIGHLAND ST | 106 |
| LOOKINGGLASS RD | 106 |
| STEWART PKY | 94 |
| DIAMOND LAKE BLVD | 84 |
| INTERSTATE 5 FWY | 80 |
| PINE ST | 70 |
| JACKSON ST | 68 |
| CARNES RD | 64 |
| MILL ST | 58 |
| I5 FWY | 56 |
| MAIN ST | 52 |
| UMPQUA HWY | 48 |
| ROBERTS CREEK RD | 46 |
| 99 HWY | 44 |
| EDENBOWER BLVD | 44 |
| HAPPY VALLEY RD | 42 |
| WINCHESTER ST | 42 |
| GARDEN VALLEY RD | 36 |
| OLD HIGHWAY 99 SOUTH | 34 |
| VINE ST | 34 |
| ALAMEDA AVE | 32 |
| MELROSE RD | 32 |
| MULHOLLAND DR | 32 |
| BUCKHORN RD | 30 |
| COOS BAY WAGON RD | 30 |
| DEL RIO RD | 30 |
| Other | 1,103 |
2002 - 2017 National Fire Incident Reporting System (NFIRS) incidents
- Incident types reported to NFIRS in Roseburg, OR
- 14,69062.7%Rescue & EMS
- 3,41314.6%Fire
- 2,41710.3%Good Intent Call
- 1,5386.6%Service Call
- 9654.1%Hazardous Condition
- 3411.5%False Alarm
- 400.2%Overpressure Rupture
- Fire incident types reported to NFIRS in Roseburg, OR
- 1,64548.2%Outside Fires
- 1,14533.5%Structure Fires
- 44213.0%Mobile Property/Vehicle Fires
- 1815.3%Other
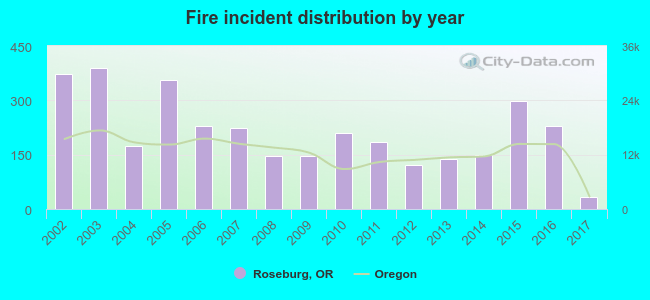 Based on the data from the years 2002 - 2017 the average number of fire incidents per year is 213. The highest number of reported fire incidents - 389 took place in 2003, and the least - 34 in 2017. The data has a decreasing trend.
The average number of yearly fire incidents per 10k residents in Roseburg, OR compared to nearest cities:
(Note: Based on data for the last 3 years, including only cities with population 5,000 and above)
| Roseburg: | 41.5 |
| Roseburg North: | 16.9 |
| Winston: | 29.3 |
| Sutherlin: | 33.9 |
| Tenmile: | 2.1 |
| Cottage Grove: | 26.7 |
| Coos Bay: | 20.8 |
| North Bend: | 23.1 |
| Creswell: | 24.8 |
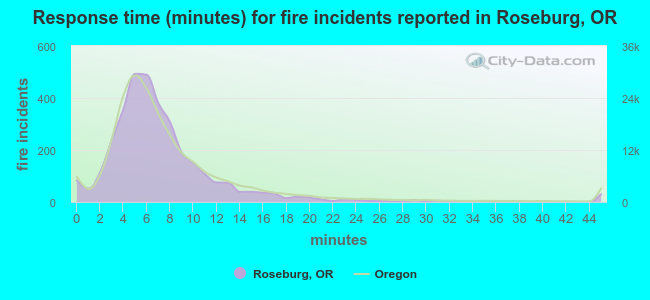 The median response time based on all reported fire incidents is 6 minutes. This is comparable to the state median value.
The median response time in Roseburg, OR compared to nearest cities:
(Note: Based on data for all years, including only cities with at least 500 fire incidents)
| Roseburg: | 6 minutes |
| Sutherlin: | 6 minutes |
| Myrtle Creek: | 7 minutes |
| Cottage Grove: | 6 minutes |
| Coos Bay: | 5 minutes |
| North Bend: | 3 minutes |
| Grants Pass: | 7 minutes |
| Eagle Point: | 9 minutes |
| Eugene: | 6 minutes |
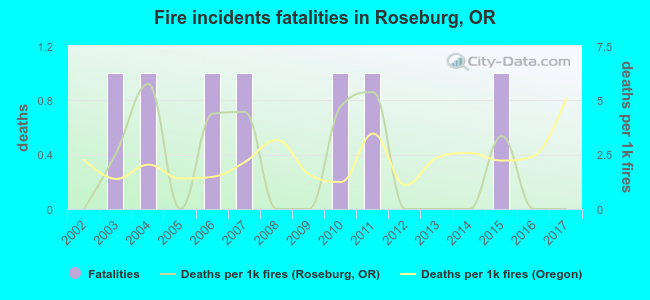 Based on the reports from the years 2002 - 2017 the average number of fire-related yearly deaths is 0. The highest number of deaths - 1 took place in 2003, and the lowest - 0 in 2002. The data has a constant trend.
The average number of fatalities per 1,000 fire incidents is 2. This indicator was the highest - 6 in 2004, and the lowest 0 in 2002. The trend for deaths per 1,000 fires is constant. Compared to the Oregon value the number of fatalities per 1,000 fires is similar.
Based on the reports from the years 2002 - 2017 the average number of fire-related yearly deaths is 0. The highest number of deaths - 1 took place in 2003, and the lowest - 0 in 2002. The data has a constant trend.
The average number of fatalities per 1,000 fire incidents is 2. This indicator was the highest - 6 in 2004, and the lowest 0 in 2002. The trend for deaths per 1,000 fires is constant. Compared to the Oregon value the number of fatalities per 1,000 fires is similar.Deaths per 1,000 incidents in Roseburg, OR compared to nearest cities:
(Note: Based on data for all years, including only cities with at least 2,500 fire incidents)
| Roseburg: | 2.1 |
| Grants Pass: | 2.1 |
| Eugene: | 1.6 |
| Springfield: | 2.1 |
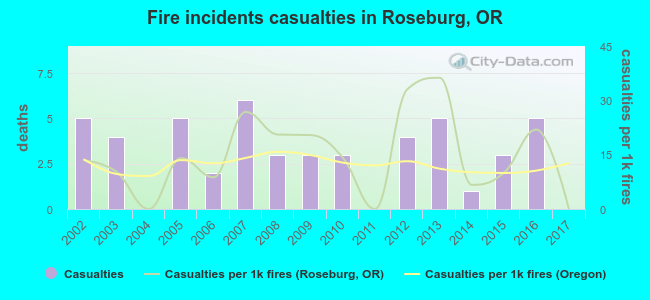 According to the data from the years 2002 - 2017 the average number of fire-related casualties per year is 3. The highest number of injuries - 6 took place in 2007, and the lowest - 0 in 2004. The data has a declining trend.
The average number of injuries per 1,000 fire incidents is 15. This indicator was the highest - 36 in 2013, and the lowest 0 in 2004. The trend for casualties per 1,000 fires is decreasing. Compared to the state value the number of casualties per 1,000 fires is similar.
According to the data from the years 2002 - 2017 the average number of fire-related casualties per year is 3. The highest number of injuries - 6 took place in 2007, and the lowest - 0 in 2004. The data has a declining trend.
The average number of injuries per 1,000 fire incidents is 15. This indicator was the highest - 36 in 2013, and the lowest 0 in 2004. The trend for casualties per 1,000 fires is decreasing. Compared to the state value the number of casualties per 1,000 fires is similar.Casualties per 1,000 incidents in Roseburg, OR compared to nearest cities:
(Note: Based on data for all years, including only cities with at least 500 fire incidents)
| Roseburg: | 14.4 |
| Sutherlin: | 8.1 |
| Myrtle Creek: | 4.1 |
| Cottage Grove: | 5.0 |
| Coos Bay: | 5.4 |
| North Bend: | 17.5 |
| Grants Pass: | 14.4 |
| Eagle Point: | 10.4 |
| Eugene: | 13.8 |
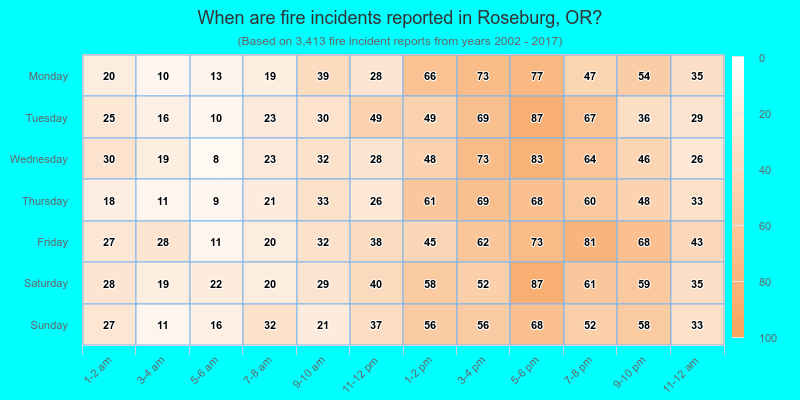
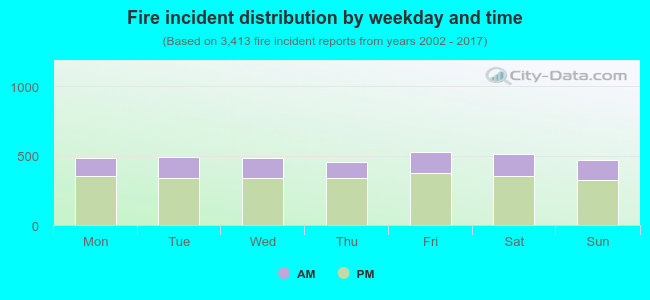 29.2% incidents where reported in the morning and 70.8% in the evening. The most fires (15.5%) took place on Friday, and the least (13.4%) on Thursday.
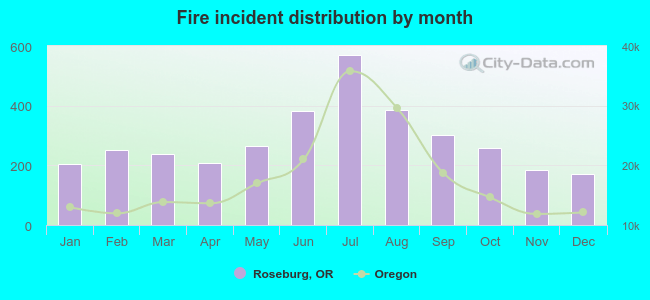 Based on the 3,413 incident reports from years 2002 - 2017 most fires (16.7%) took place during July, and the least (5.0%) in December.
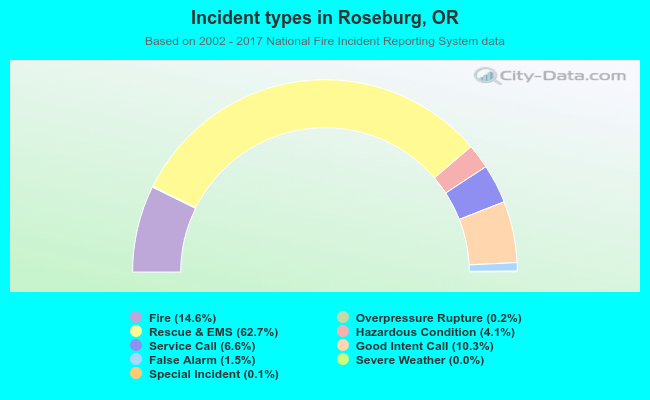 Out of all 23,427 cases reported during the years 2002 - 2017, the most belonged to the categories: Rescue & EMS (62.7%), Fire (14.6%), and Good Intent Call (10.3%).
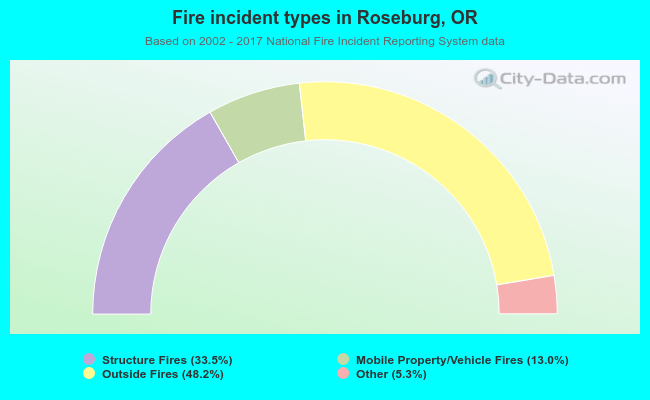 When looking into fire subcategories, the most reports belonged to: Outside Fires (48.2%), and Structure Fires (33.5%).