Creswell: Fire Incidents, Oregon (OR)
Where are fire incidents reported in Creswell, OR
Something went wrong! Please refresh the page.
|
| |||||||||||||||||||||||||||||||||||||||||||||||||||||||||||||||||||||||||||||||||||||||||||||||||||||||||||||
2002 - 2018 National Fire Incident Reporting System (NFIRS) incidents
- Incident types reported to NFIRS in Creswell, OR
- 2,34273.3%Rescue & EMS
- 42513.3%Fire
- 1986.2%Good Intent Call
- 1043.3%Hazardous Condition
- 732.3%Service Call
- 501.6%False Alarm
- Fire incident types reported to NFIRS in Creswell, OR
- 17541.2%Outside Fires
- 14032.9%Structure Fires
- 8620.2%Mobile Property/Vehicle Fires
- 245.6%Other
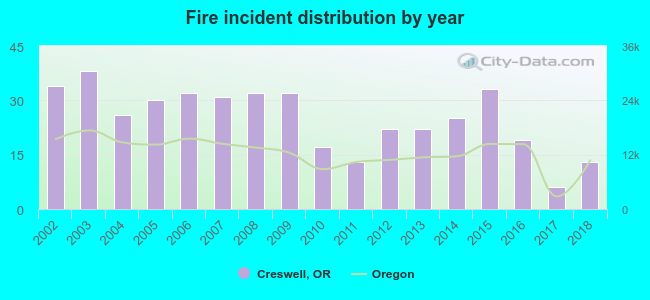 Based on the data from the years 2002 - 2018 the average number of fire incidents per year is 25. The highest number of fires - 38 took place in 2003, and the least - 6 in 2017. The data has a decreasing trend.
The average number of yearly fire incidents per 10k residents in Creswell, OR compared to nearest cities:
(Note: Based on data for the last 3 years, including only cities with population 5,000 and above)
| Creswell: | 24.8 |
| Pleasant Hill: | 45.9 |
| Cottage Grove: | 26.7 |
| Springfield: | 18.4 |
| Eugene: | 24.4 |
| Junction City: | 44.4 |
| Sweet Home: | 30.3 |
| Sutherlin: | 33.9 |
| Lebanon: | 31.7 |

 Based on the reports from the years 2002 - 2018 the average number of fire-related yearly deaths is 0. The highest number of deaths - 3 took place in 2014, and the lowest - 0 in 2003. The data has a declining trend.
 Based on the data from the years 2002 - 2018 the average number of fire-related casualties per year is 0. The highest number of reported casualties - 4 took place in 2014, and the lowest - 0 in 2003. The data has a dropping trend.
 27.8% incidents where reported in the morning and 72.2% in the evening. The most fires (18.4%) took place on Sunday, and the least (12.2%) on Tuesday.
 Based on the 425 fire incident reports from years 2002 - 2018 most fires (19.5%) took place during July, and the least (4.0%) in November.
 Out of all 3,193 cases reported during the years 2002 - 2018, the most belonged to the categories: Overpressure Rupture (73.3%), Fire (13.3%), and Service Call (6.2%).
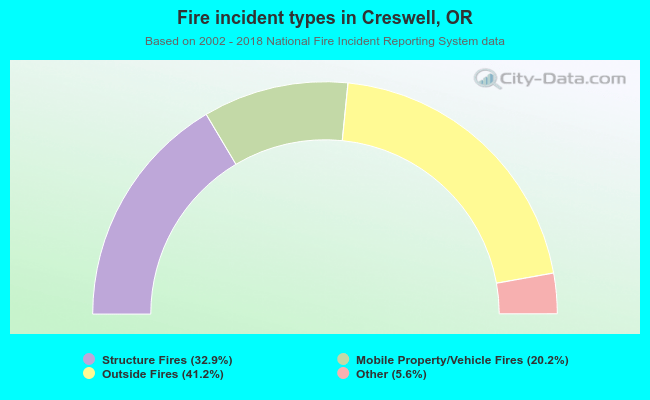 When looking into fire subcategories, the most reports belonged to: Outside Fires (41.2%), and Structure Fires (32.9%).