Raritan: Fire Incidents, New Jersey (NJ)
Where are fire incidents reported in Raritan, NJ
Something went wrong! Please refresh the page.
|
| |||||||||||||||||||||||||||||||||||||||||||||||||||||||||||||||||||||||||||||||||||||||||||||||||||||||||||||
2004 - 2018 National Fire Incident Reporting System (NFIRS) incidents
- Incident types reported to NFIRS in Raritan, NJ
- 53436.4%Hazardous Condition
- 39827.1%False Alarm
- 34623.6%Fire
- 835.7%Service Call
- 604.1%Good Intent Call
- 392.7%Rescue & EMS
- 40.3%Overpressure Rupture
- 20.1%Severe Weather
- 20.1%Special Incident
- Fire incident types reported to NFIRS in Raritan, NJ
- 16046.2%Structure Fires
- 10730.9%Outside Fires
- 5415.6%Mobile Property/Vehicle Fires
- 257.2%Other
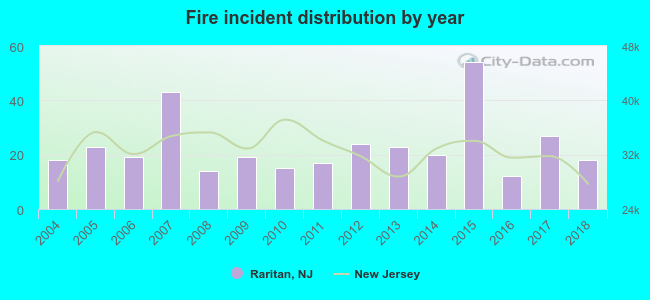 Based on the data from the years 2004 - 2018 the average number of fires per year is 23. The highest number of fire incidents - 54 took place in 2015, and the least - 12 in 2016. The data has a constant trend.
The average number of yearly fire incidents per 10k residents in Raritan, NJ compared to nearest cities:
(Note: Based on data for the last 3 years, including only cities with population 5,000 and above)
| Raritan: | 23.5 |
| Somerville: | 36.8 |
| Finderne: | 1.8 |
| Manville: | 7.7 |
| Martinsville: | 19.5 |
| Bound Brook: | 2.4 |
| Middlesex: | 2.9 |
| Dunellen: | 9.0 |
| Somerset: | 43.2 |

 25.7% incidents where reported in the morning and 74.3% in the evening. The most fires (16.5%) took place on Tuesday, and the least (11.3%) on Wednesday.
 Based on the 346 fire incidents from years 2004 - 2018 most fires (15.0%) took place during April, and the least (4.9%) in August.
 Out of all 1,468 cases reported during the years 2004 - 2018, the most belonged to the categories: Hazardous Condition (36.4%), False Alarm (27.1%), and Fire (23.6%).
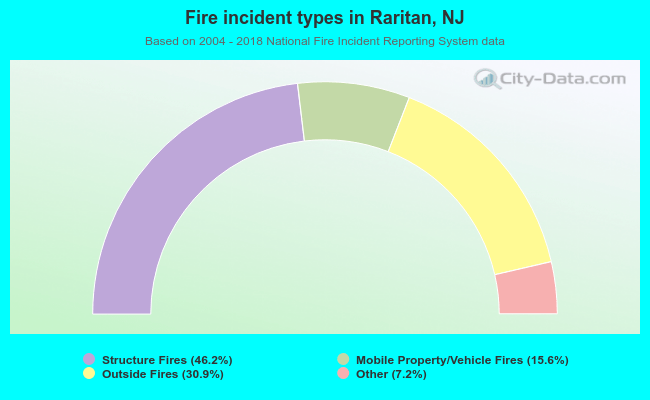 When looking into fire subcategories, the most incidents belonged to: Structure Fires (46.2%), and Outside Fires (30.9%).