Ramsey: Fire Incidents, New Jersey (NJ)
Where are fire incidents reported in Ramsey, NJ
Something went wrong! Please refresh the page.
| Fire incidents reported | |
|---|---|
| Sreet name | Count |
| STATE HIGHWAY 17 | 346 |
| FRANKLIN TPKE | 164 |
| MAIN ST | 136 |
| CHURCH ST | 80 |
| CENTRAL AVE | 76 |
| PROSPECT ST | 60 |
| GROVE ST | 38 |
| INTERSTATE WAY | 34 |
| AIRMOUNT AVE | 30 |
| CRESCENT AVE | 30 |
| DARLINGTON AVE | 30 |
| ISLAND RD | 28 |
| WYCKOFF AVE | 28 |
| ISLAND AVE | 24 |
| NORMAN DR | 24 |
| CANTERBURY DR | 22 |
| NOTTINGHAM RD | 20 |
| OAK ST | 20 |
| SPRUCE ST | 20 |
| WILLIAMS DR | 20 |
| DEER TRAIL | 18 |
| PEACH HILL CT | 18 |
| ELBERT ST | 16 |
| HARLIND TER | 16 |
| MYRTLE AVE | 16 |
| PRINCE ST | 16 |
| SPRING ST | 16 |
| TIMBER TRAIL | 16 |
| CAROL ST | 14 |
| DAVIDSON AVE | 14 |
2004 - 2018 National Fire Incident Reporting System (NFIRS) incidents
- Incident types reported to NFIRS in Ramsey, NJ
- 1,15634.1%Hazardous Condition
- 1,10432.6%Fire
- 69720.6%False Alarm
- 2647.8%Good Intent Call
- 1123.3%Service Call
- 250.7%Severe Weather
- 110.3%Overpressure Rupture
- 110.3%Rescue & EMS
- 60.2%Special Incident
- Fire incident types reported to NFIRS in Ramsey, NJ
- 76269.0%Structure Fires
- 23621.4%Outside Fires
- 877.9%Mobile Property/Vehicle Fires
- 191.7%Other
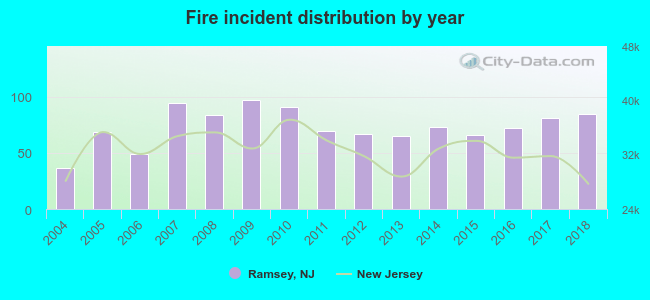 Based on the data from the years 2004 - 2018 the average number of fires per year is 73. The highest number of fire incidents - 97 took place in 2009, and the least - 37 in 2004. The data has an increasing trend.
The average number of yearly fire incidents per 10k residents in Ramsey, NJ compared to nearest cities:
(Note: Based on data for the last 3 years, including only cities with population 5,000 and above)
| Ramsey: | 53.6 |
| Allendale: | 31.9 |
| Upper Saddle River: | 16.0 |
| Waldwick: | 16.8 |
| Wyckoff: | 51.7 |
| Midland Park: | 19.6 |
| Franklin Lakes: | 20.3 |
| Woodcliff Lake: | 6.2 |
| Montvale: | 9.2 |
 The median response time based on all reported fire incidents is 7 minutes. This is higher compared to the state median value.
The median response time in Ramsey, NJ compared to nearest cities:
(Note: Based on data for all years, including only cities with at least 500 fire incidents)
| Ramsey: | 7 minutes |
| Wyckoff: | 5 minutes |
| Oakland: | 5 minutes |
| Ridgewood: | 3 minutes |
| Ringwood: | 3 minutes |
| Hawthorne: | 5 minutes |
| Fair Lawn: | 5 minutes |
| Oradell: | 4 minutes |
| Wayne: | 5 minutes |
 27.8% incidents where reported in the morning and 72.2% in the evening. The most fires (15.9%) took place on Monday, and the least (11.4%) on Tuesday.
 Based on the 1,104 fires from years 2004 - 2018 most fires (11.0%) took place during April, and the least (6.3%) in February.
 Out of all 3,386 cases reported during the years 2004 - 2018, the most belonged to the categories: Hazardous Condition (34.1%), Fire (32.6%), and False Alarm (20.6%).
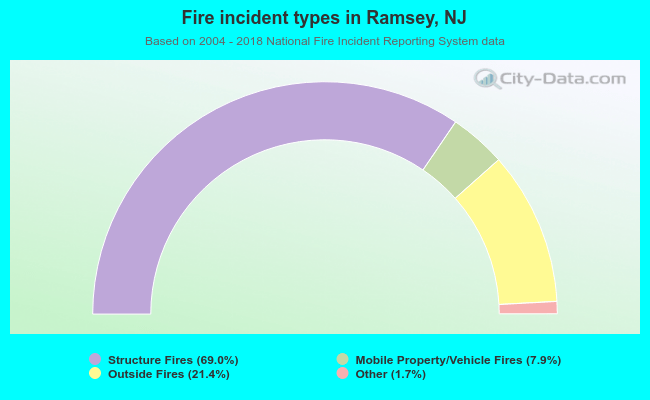 When looking into fire subcategories, the most incidents belonged to: Structure Fires (69.0%), and Outside Fires (21.4%).