Pratt: Fire Incidents, Kansas (KS)
Where are fire incidents reported in Pratt, KS
Something went wrong! Please refresh the page.
|
| |||||||||||||||||||||||||||||||||||||||||||||||||||||||||||||||||||||||||||||||||||||||||||||||||||||||||||||
| Other | 227 | |||||||||||||||||||||||||||||||||||||||||||||||||||||||||||||||||||||||||||||||||||||||||||||||||||||||||||||
2002 - 2018 National Fire Incident Reporting System (NFIRS) incidents
- Incident types reported to NFIRS in Pratt, KS
- 85961.7%Fire
- 19413.9%Hazardous Condition
- 1017.3%False Alarm
- 997.1%Good Intent Call
- 815.8%Rescue & EMS
- 493.5%Service Call
- 40.3%Overpressure Rupture
- 30.2%Special Incident
- 20.1%Severe Weather
- Fire incident types reported to NFIRS in Pratt, KS
- 52461.0%Outside Fires
- 19322.5%Structure Fires
- 11713.6%Mobile Property/Vehicle Fires
- 252.9%Other
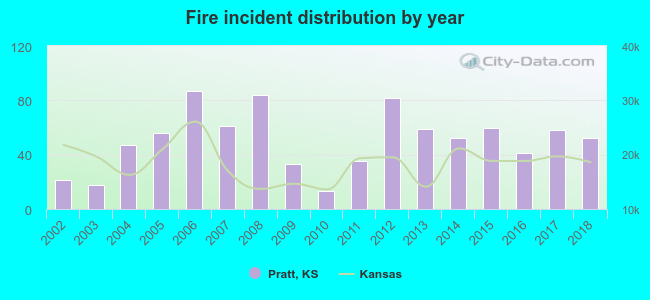 Based on the data from the years 2002 - 2018 the average number of fires per year is 51. The highest number of reported fire incidents - 87 took place in 2006, and the least - 13 in 2010. The data has a growing trend.
The average number of yearly fire incidents per 10k residents in Pratt, KS compared to nearest cities:
(Note: Based on data for the last 3 years, including only cities with population 5,000 and above)
| Pratt: | 72.3 |
| Great Bend: | 58.9 |
| Hutchinson: | 83.9 |
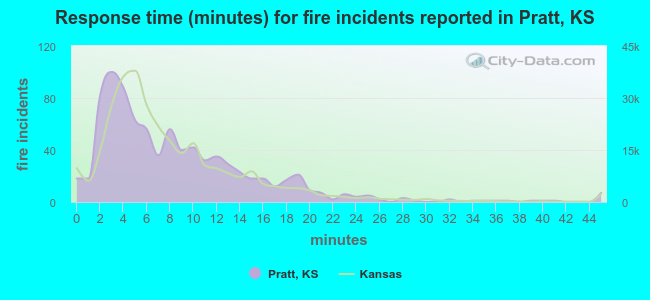 The median response time based on all reported fire incidents is 7 minutes. This is about the same as the state median value.
The median response time in Pratt, KS compared to nearest cities:
(Note: Based on data for all years, including only cities with at least 500 fire incidents)
| Pratt: | 7 minutes |
| Kingman: | 9 minutes |
| Larned: | 8 minutes |
| Great Bend: | 5 minutes |
| Cheney: | 10 minutes |
| Hutchinson: | 6 minutes |
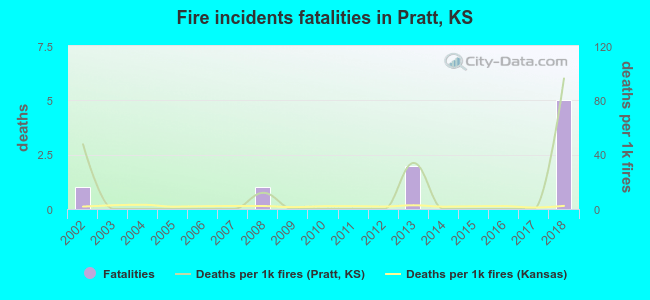 According to the data from the years 2002 - 2018 the average number of fire-related fatalities per year is 1. The highest number of deaths - 5 took place in 2018, and the lowest - 0 in 2003. The data has a growing trend.
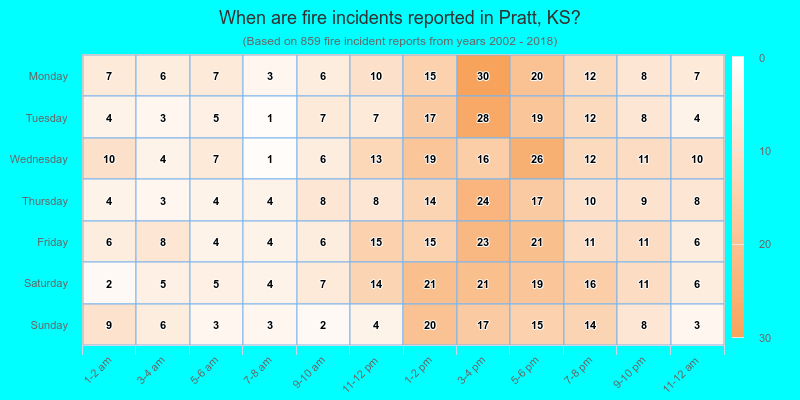
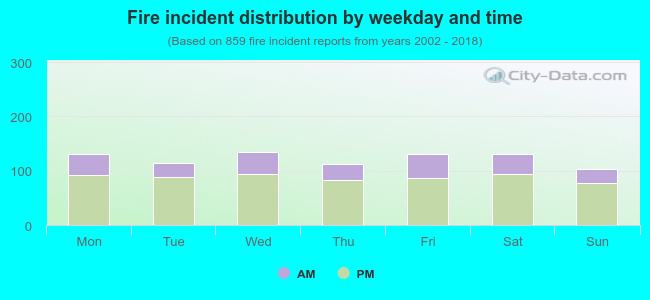 28.5% incidents where reported in the morning and 71.5% in the evening. The most fires (15.7%) took place on Wednesday, and the least (12.1%) on Sunday.
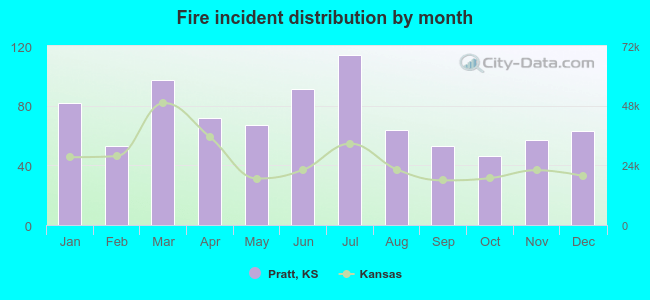 According to the 859 fire incident reports from years 2002 - 2018 most fires (13.3%) took place during July, and the least (5.4%) in October.
 Out of all 1,392 cases reported during the years 2002 - 2018, the most belonged to the categories: Fire (61.7%), Hazardous Condition (13.9%), and False Alarm (7.3%).
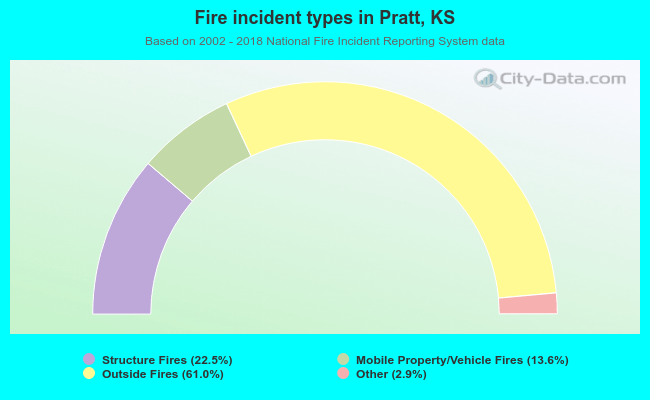 When looking into fire subcategories, the most reports belonged to: Outside Fires (61.0%), and Structure Fires (22.5%).