Great Bend: Fire Incidents, Kansas (KS)
Where are fire incidents reported in Great Bend, KS
Something went wrong! Please refresh the page.
| Fire incidents reported | |
|---|---|
| Sreet name | Count |
| 10TH ST | 176 |
| 2ND ST | 56 |
| MAIN ST | 46 |
| RAILROAD AVE | 44 |
| 30 RD | 42 |
| 9TH ST | 42 |
| 24TH ST | 38 |
| 281 HWY | 36 |
| 30TH ROAD | 36 |
| BARTON COUNTY RD | 36 |
| BROADWAY AVE | 34 |
| MORTON ST | 34 |
| WASHINGTON AVE | 34 |
| 10TH AVE | 32 |
| 20 RD | 32 |
| HUBBARD ST | 32 |
| 10 RD | 30 |
| 50 AVE | 30 |
| WASHINGTON ST | 30 |
| 60TH AVE | 28 |
| ADAMS ST | 28 |
| KANSAS AVE | 28 |
| 10 AVE | 26 |
| 16TH ST | 26 |
| FREY ST | 26 |
| 60 AVE | 24 |
| 8TH ST | 24 |
| 30 AVE | 22 |
| 30TH RD | 22 |
| 5 AVE | 22 |
| Other | 456 |
2005 - 2018 National Fire Incident Reporting System (NFIRS) incidents
- Incident types reported to NFIRS in Great Bend, KS
- 7,00268.4%Rescue & EMS
- 1,57215.4%Fire
- 8188.0%Hazardous Condition
- 3033.0%False Alarm
- 2842.8%Good Intent Call
- 2352.3%Service Call
- 130.1%Overpressure Rupture
- Fire incident types reported to NFIRS in Great Bend, KS
- 74747.5%Outside Fires
- 56135.7%Structure Fires
- 21213.5%Mobile Property/Vehicle Fires
- 523.3%Other
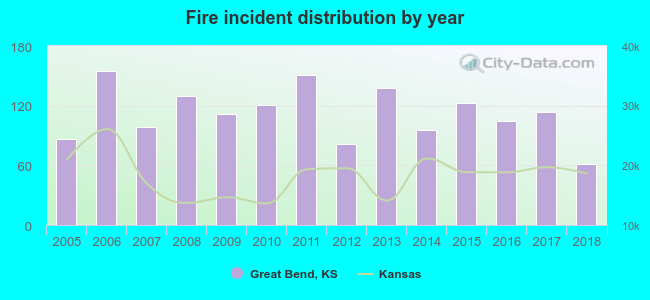 According to the data from the years 2005 - 2018 the average number of fires per year is 112. The highest number of reported fires - 155 took place in 2006, and the least - 61 in 2018. The data has a decreasing trend.
The average number of yearly fire incidents per 10k residents in Great Bend, KS compared to nearest cities:
(Note: Based on data for the last 3 years, including only cities with population 5,000 and above)
| Great Bend: | 58.9 |
| Hays: | 51.6 |
| Pratt: | 72.3 |
| Hutchinson: | 83.9 |
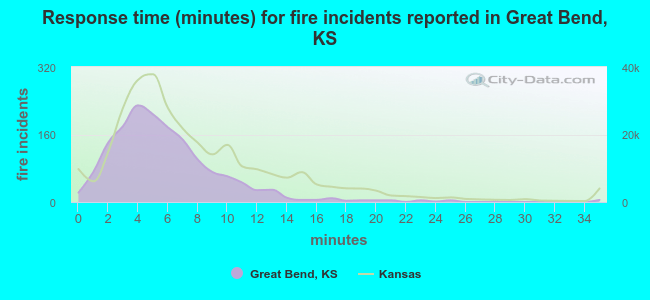 The median response time based on all reported fire incidents is 5 minutes. This is lower than the Kansas median value.
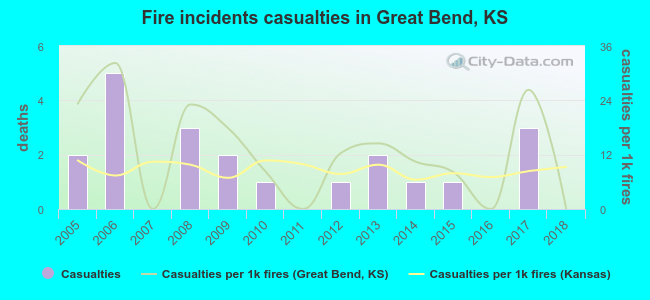 Based on the reports from the years 2005 - 2018 the average number of fire-related yearly casualties is 2. The highest number of injuries - 5 took place in 2006, and the lowest - 0 in 2007. The data has a declining trend.
The average number of injuries per 1,000 fires is 13. This indicator was the highest - 32 in 2006, and the lowest 0 in 2007. The trend for casualties per 1,000 incidents is decreasing. Compared to the Kansas value the number of casualties per 1,000 incidents is higher.
Based on the reports from the years 2005 - 2018 the average number of fire-related yearly casualties is 2. The highest number of injuries - 5 took place in 2006, and the lowest - 0 in 2007. The data has a declining trend.
The average number of injuries per 1,000 fires is 13. This indicator was the highest - 32 in 2006, and the lowest 0 in 2007. The trend for casualties per 1,000 incidents is decreasing. Compared to the Kansas value the number of casualties per 1,000 incidents is higher.
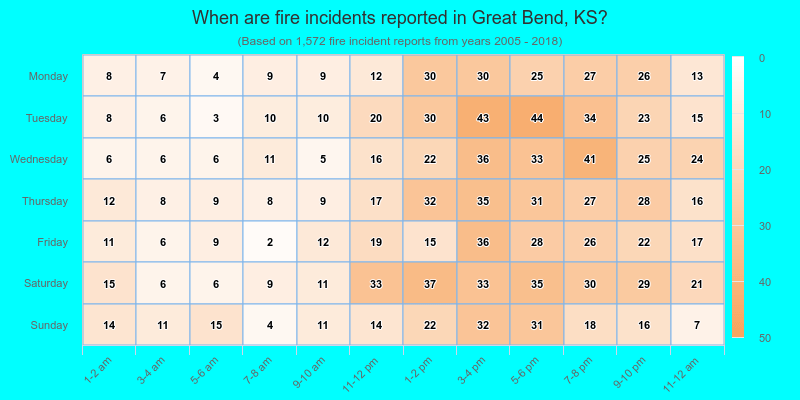
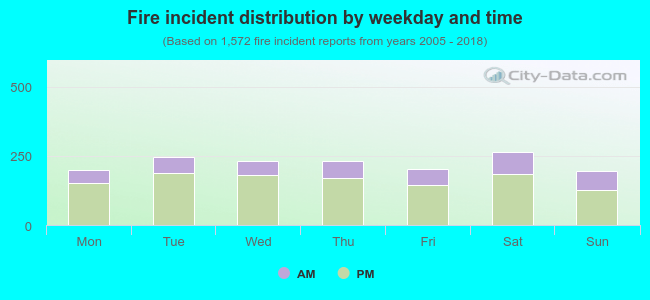 27.2% incidents where reported in the morning and 72.8% in the evening. The most fires (16.9%) took place on Saturday, and the least (12.4%) on Sunday.
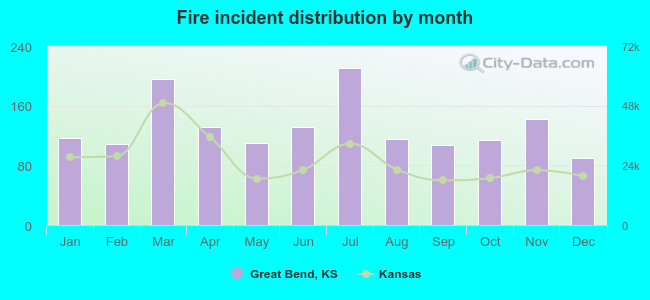 Based on the 1,572 fires from years 2005 - 2018 most fires (13.4%) took place during July, and the least (5.7%) in December.
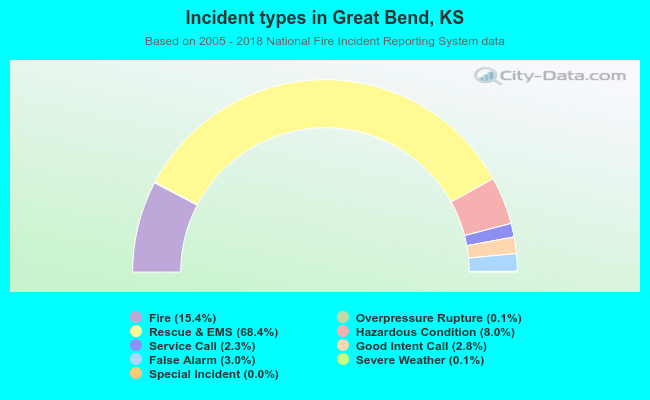 Out of all 10,237 cases reported during the years 2005 - 2018, the most belonged to the categories: Rescue & EMS (68.4%), Fire (15.4%), and Hazardous Condition (8.0%).
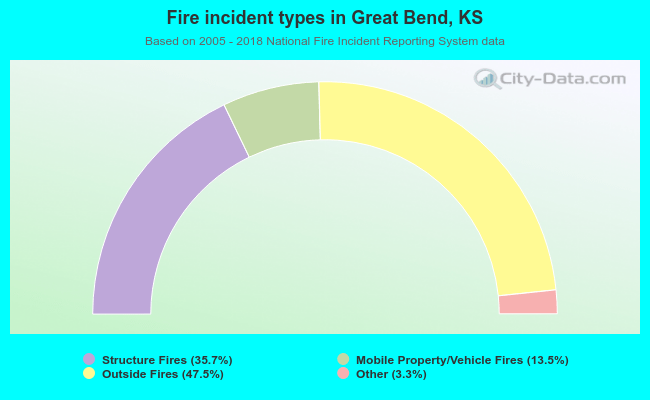 When looking into fire subcategories, the most incidents belonged to: Outside Fires (47.5%), and Structure Fires (35.7%).