Petal: Fire Incidents, Mississippi (MS)
Where are fire incidents reported in Petal, MS
Something went wrong! Please refresh the page.
| Fire incidents reported | |
|---|---|
| Sreet name | Count |
| OLD RIVER RD | 84 |
| HWY 42 | 74 |
| SUNRISE RD | 70 |
| OLD RICHTON RD | 58 |
| HWY 29 | 56 |
| MACEDONIA ROAD | 54 |
| MAIN ST | 50 |
| MORRISTON ROAD | 50 |
| SHEEPLO LOOP | 50 |
| HIGHWAY 11 | 46 |
| OLD RIFLE RANGE RD | 40 |
| HIGHWAY 42 | 38 |
| LEEVILLE ROAD | 38 |
| LUTHER CARTER RD | 38 |
| OLD RICHTON ROAD | 38 |
| CARTERVILLE RD | 34 |
| HWY 11 | 32 |
| MC GILVARY RD | 32 |
| RUGER RD | 32 |
| POP RUNNELS ROAD | 30 |
| GEORGE ST | 28 |
| BUTLER RD | 26 |
| LEEVILLE RD | 26 |
| 42 HWY | 24 |
| PUMPING STATION ROAD | 24 |
| BATSON RD | 22 |
| CENTRAL AVE | 22 |
| EASTABUCHIE ROAD | 22 |
| HERRINGTON ROAD | 22 |
| HILLCREST LOOP | 22 |
| Other | 1,124 |
2002 - 2018 National Fire Incident Reporting System (NFIRS) incidents
- Incident types reported to NFIRS in Petal, MS
- 4,22449.8%Rescue & EMS
- 2,30627.2%Fire
- 6747.9%Hazardous Condition
- 6127.2%Service Call
- 3414.0%False Alarm
- 2432.9%Good Intent Call
- 490.6%Special Incident
- 280.3%Severe Weather
- 100.1%Overpressure Rupture
- Fire incident types reported to NFIRS in Petal, MS
- 1,24053.8%Outside Fires
- 68829.8%Structure Fires
- 24410.6%Mobile Property/Vehicle Fires
- 1345.8%Other
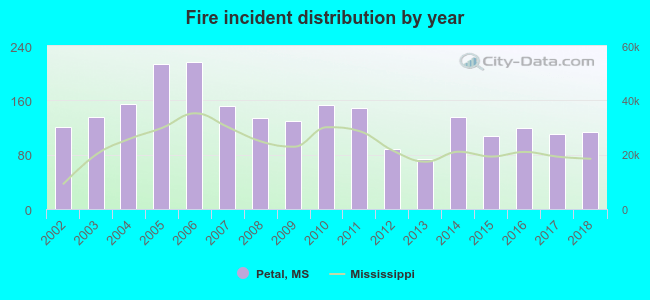 Based on the data from the years 2002 - 2018 the average number of fire incidents per year is 136. The highest number of reported fire incidents - 216 took place in 2006, and the least - 74 in 2013. The data has a decreasing trend.
The average number of yearly fire incidents per 10k residents in Petal, MS compared to nearest cities:
(Note: Based on data for the last 3 years, including only cities with population 5,000 and above)
| Petal: | 106.6 |
| Hattiesburg: | 102.0 |
| Laurel: | 237.3 |
| Columbia: | 154.6 |
| Picayune: | 170.6 |
| Vancleave: | 115.5 |
 The median response time based on all reported fire incidents is 5 minutes. This is lower compared to the Mississippi median value.
The median response time in Petal, MS compared to nearest cities:
(Note: Based on data for all years, including only cities with at least 500 fire incidents)
| Petal: | 5 minutes |
| Hattiesburg: | 5 minutes |
| Purvis: | 7 minutes |
| Ellisville: | 9 minutes |
| Sumrall: | 9 minutes |
| Richton: | 11 minutes |
| Seminary: | 9 minutes |
| Laurel: | 8 minutes |
| Lumberton: | 9 minutes |
 Based on the reports from the years 2002 - 2018 the average number of fire-related yearly casualties is 0. The highest number of casualties - 3 took place in 2003, and the lowest - 0 in 2004. The data has a constant trend.
The average number of casualties per 1,000 fire incidents is 4. This indicator was the highest - 22 in 2003, and the lowest 0 in 2004. The trend for casualties per 1,000 fire incidents is increasing. Compared to the Mississippi value the number of casualties per 1,000 fire incidents is about the same.
Based on the reports from the years 2002 - 2018 the average number of fire-related yearly casualties is 0. The highest number of casualties - 3 took place in 2003, and the lowest - 0 in 2004. The data has a constant trend.
The average number of casualties per 1,000 fire incidents is 4. This indicator was the highest - 22 in 2003, and the lowest 0 in 2004. The trend for casualties per 1,000 fire incidents is increasing. Compared to the Mississippi value the number of casualties per 1,000 fire incidents is about the same.Casualties per 1,000 incidents in Petal, MS compared to nearest cities:
(Note: Based on data for all years, including only cities with at least 500 fire incidents)
| Petal: | 3.0 |
| Hattiesburg: | 4.5 |
| Purvis: | 1.7 |
| Ellisville: | 3.1 |
| Sumrall: | 1.2 |
| Richton: | 0.0 |
| Seminary: | 0.0 |
| Laurel: | 5.6 |
| Lumberton: | 0.3 |
 25.4% incidents where reported in the morning and 74.6% in the evening. The most fires (15.8%) took place on Monday, and the least (13.3%) on Thursday.
 Based on the 2,306 fire incident reports from years 2002 - 2018 most fires (12.5%) took place during March, and the least (6.4%) in July.
 Out of all 8,487 cases reported during the years 2002 - 2018, the most belonged to the categories: Rescue & EMS (49.8%), Fire (27.2%), and Hazardous Condition (7.9%).
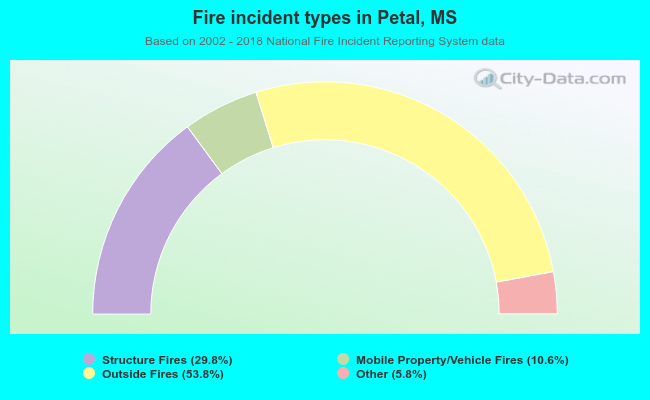 When looking into fire subcategories, the most incidents belonged to: Outside Fires (53.8%), and Structure Fires (29.8%).