Hattiesburg: Fire Incidents, Mississippi (MS)
Where are fire incidents reported in Hattiesburg, MS
Something went wrong! Please refresh the page.
| Fire incidents reported | |
|---|---|
| Sreet name | Count |
| 49 HWY | 554 |
| HARDY ST | 400 |
| OAK GROVE RD | 308 |
| 4TH ST | 266 |
| 59 HWY | 216 |
| 7TH ST | 186 |
| HIGHWAY 49 | 178 |
| 98 HWY | 166 |
| BROADWAY DR | 152 |
| EDWARDS ST | 136 |
| JAMES ST | 134 |
| OLD HWY 24 | 114 |
| COUNTRY CLUB RD | 106 |
| PINE ST | 104 |
| LINCOLN RD | 102 |
| HARTFIELD RD | 100 |
| OLD HWY 11 | 96 |
| U S HWY 98 | 94 |
| HELVESTON RD | 90 |
| MONROE RD | 90 |
| RICHBURG RD | 88 |
| MAIN ST | 80 |
| HWY 589 | 78 |
| MABLE ST | 76 |
| 28TH AVE | 70 |
| KATIE AVE | 70 |
| EATONVILLE RD | 68 |
| 42 HWY | 62 |
| BURNT BRIDGE RD | 62 |
| CENTRAL SCHOOL RD | 62 |
| Other | 4,663 |
2002 - 2018 National Fire Incident Reporting System (NFIRS) incidents
- Incident types reported to NFIRS in Hattiesburg, MS
- 13,46440.8%Rescue & EMS
- 8,97127.2%Fire
- 3,89311.8%Hazardous Condition
- 2,4537.4%Service Call
- 2,2176.7%Good Intent Call
- 1,5464.7%False Alarm
- 1740.5%Special Incident
- 1560.5%Severe Weather
- 1110.3%Overpressure Rupture
- Fire incident types reported to NFIRS in Hattiesburg, MS
- 3,96544.2%Outside Fires
- 3,16835.3%Structure Fires
- 1,42215.9%Mobile Property/Vehicle Fires
- 4164.6%Other
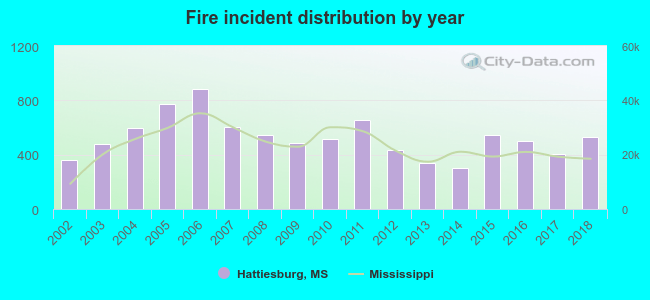 According to the data from the years 2002 - 2018 the average number of fire incidents per year is 528. The highest number of fire incidents - 885 took place in 2006, and the least - 305 in 2014. The data has an increasing trend.
The average number of yearly fire incidents per 10k residents in Hattiesburg, MS compared to nearest cities:
(Note: Based on data for the last 3 years, including only cities with population 5,000 and above)
| Hattiesburg: | 102.0 |
| Petal: | 106.6 |
| Laurel: | 237.3 |
| Columbia: | 154.6 |
| Picayune: | 170.6 |
| Diamondhead: | 24.9 |
| Gulfport: | 58.2 |
| Vancleave: | 115.5 |
 The median response time based on all reported fire incidents is 5 minutes. This is lower than the Mississippi median value.
The median response time in Hattiesburg, MS compared to nearest cities:
(Note: Based on data for all years, including only cities with at least 500 fire incidents)
| Hattiesburg: | 5 minutes |
| Petal: | 5 minutes |
| Purvis: | 7 minutes |
| Sumrall: | 9 minutes |
| Seminary: | 9 minutes |
| Ellisville: | 9 minutes |
| Richton: | 11 minutes |
| Lumberton: | 9 minutes |
| Collins: | 9 minutes |
 Based on the data from the years 2002 - 2018 the average number of fire-related fatalities per year is 1. The highest number of deaths - 3 took place in 2011, and the lowest - 0 in 2004. The data has a dropping trend.
The average number of deaths per 1,000 fire incidents is 2. This indicator was the highest - 6 in 2002, and the lowest 0 in 2004. The trend for deaths per 1,000 incidents is decreasing. Compared to the Mississippi value the number of deaths per 1,000 fire incidents is lower.
Based on the data from the years 2002 - 2018 the average number of fire-related fatalities per year is 1. The highest number of deaths - 3 took place in 2011, and the lowest - 0 in 2004. The data has a dropping trend.
The average number of deaths per 1,000 fire incidents is 2. This indicator was the highest - 6 in 2002, and the lowest 0 in 2004. The trend for deaths per 1,000 incidents is decreasing. Compared to the Mississippi value the number of deaths per 1,000 fire incidents is lower.
 According to the reports from the years 2002 - 2018 the average number of fire-related yearly casualties is 2. The highest number of casualties - 9 took place in 2008, and the lowest - 0 in 2009. The data has a constant trend.
The average number of casualties per 1,000 fires is 4. This indicator was the highest - 17 in 2008, and the lowest 0 in 2009. The trend for casualties per 1,000 fires is declining. Compared to the Mississippi value the number of injuries per 1,000 incidents is higher.
According to the reports from the years 2002 - 2018 the average number of fire-related yearly casualties is 2. The highest number of casualties - 9 took place in 2008, and the lowest - 0 in 2009. The data has a constant trend.
The average number of casualties per 1,000 fires is 4. This indicator was the highest - 17 in 2008, and the lowest 0 in 2009. The trend for casualties per 1,000 fires is declining. Compared to the Mississippi value the number of injuries per 1,000 incidents is higher.
 29.2% incidents where reported in the morning and 70.8% in the evening. The most fires (15.3%) took place on Saturday, and the least (13.3%) on Tuesday.
 According to the 8,971 fire incidents from years 2002 - 2018 most fires (11.1%) took place during March, and the least (6.5%) in August.
 Out of all 32,985 cases reported during the years 2002 - 2018, the most belonged to the categories: Rescue & EMS (40.8%), Fire (27.2%), and Hazardous Condition (11.8%).
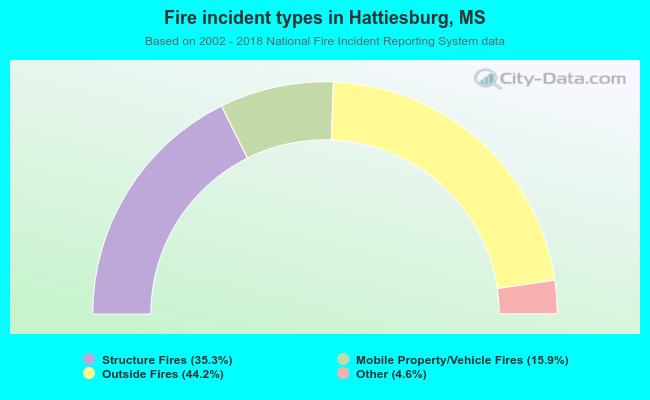 When looking into fire subcategories, the most incidents belonged to: Outside Fires (44.2%), and Structure Fires (35.3%).