Ottawa: Fire Incidents, Kansas (KS)
Where are fire incidents reported in Ottawa, KS
Something went wrong! Please refresh the page.
| Fire incidents reported | |
|---|---|
| Sreet name | Count |
| CEDAR ST | 148 |
| MAIN | 148 |
| LOCUST ST | 90 |
| MAIN ST | 78 |
| MULBERRY ST | 74 |
| ELM ST | 68 |
| LOGAN ST | 66 |
| POPLAR ST | 62 |
| OAK ST | 60 |
| SYCAMORE ST | 54 |
| CHERRY ST | 52 |
| HICKORY ST | 52 |
| WILLOW ST | 48 |
| ASH | 46 |
| INDIANA RD | 42 |
| 15TH ST | 38 |
| 9TH ST | 38 |
| LABETTE RD | 38 |
| RENO RD | 38 |
| EISENHOWER RD | 36 |
| MAPLE ST | 36 |
| ASH ST | 34 |
| OSBORNE TER | 34 |
| 5TH ST | 30 |
| KING ST | 30 |
| KINGMAN RD | 30 |
| PRINCETON RD | 28 |
| WILSON ST | 28 |
| 2ND ST | 26 |
| 7TH ST | 26 |
| Other | 329 |
2002 - 2018 National Fire Incident Reporting System (NFIRS) incidents
- Incident types reported to NFIRS in Ottawa, KS
- 6,21448.0%Rescue & EMS
- 2,38918.4%Good Intent Call
- 1,90714.7%Fire
- 1,31910.2%Hazardous Condition
- 6695.2%False Alarm
- 4033.1%Service Call
- 220.2%Overpressure Rupture
- 210.2%Special Incident
- Fire incident types reported to NFIRS in Ottawa, KS
- 92148.3%Outside Fires
- 61932.5%Structure Fires
- 32016.8%Mobile Property/Vehicle Fires
- 472.5%Other
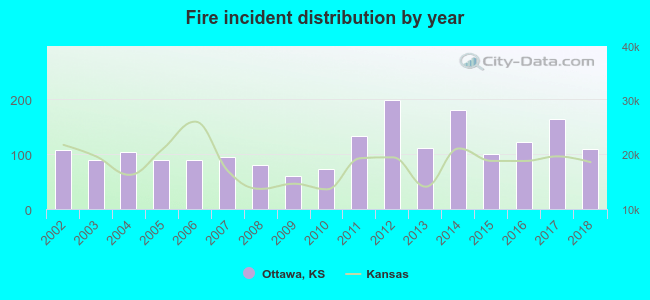 According to the data from the years 2002 - 2018 the average number of fire incidents per year is 112. The highest number of reported fire incidents - 198 took place in 2012, and the least - 61 in 2009. The data has a growing trend.
The average number of yearly fire incidents per 10k residents in Ottawa, KS compared to nearest cities:
(Note: Based on data for the last 3 years, including only cities with population 5,000 and above)
| Ottawa: | 106.2 |
| Paola: | 171.0 |
| Gardner: | 33.9 |
| Lawrence: | 40.1 |
| Eudora: | 108.4 |
| Spring Hill: | 96.7 |
| De Soto: | 36.4 |
| Olathe: | 21.1 |
| Tonganoxie: | 213.8 |
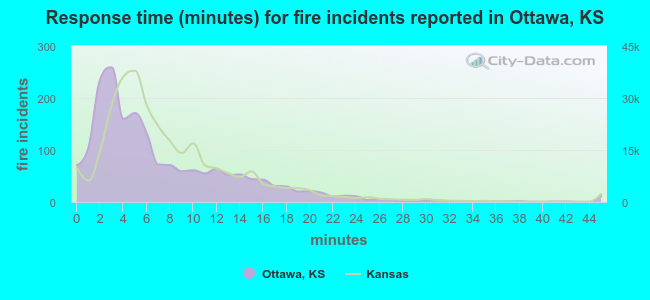 The median response time based on all reported fire incidents is 5 minutes. This is lower compared to the Kansas median value.
The median response time in Ottawa, KS compared to nearest cities:
(Note: Based on data for all years, including only cities with at least 500 fire incidents)
| Ottawa: | 5 minutes |
| Baldwin City: | 9 minutes |
| Wellsville: | 10 minutes |
| Osawatomie: | 9 minutes |
| Paola: | 10 minutes |
| Lyndon: | 10 minutes |
| Garnett: | 10 minutes |
| Gardner: | 6 minutes |
| Lawrence: | 6 minutes |
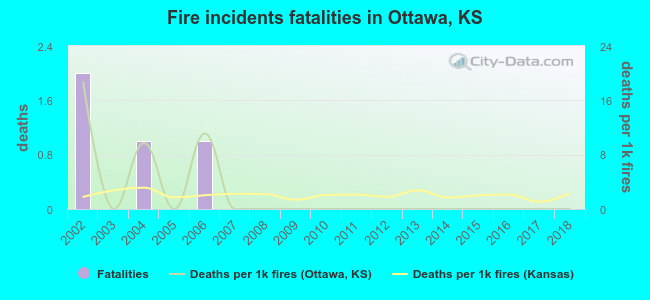 According to the reports from the years 2002 - 2018 the average number of fire-related yearly deaths is 0. The highest number of reported deaths - 2 took place in 2002, and the lowest - 0 in 2003. The data has a declining trend.
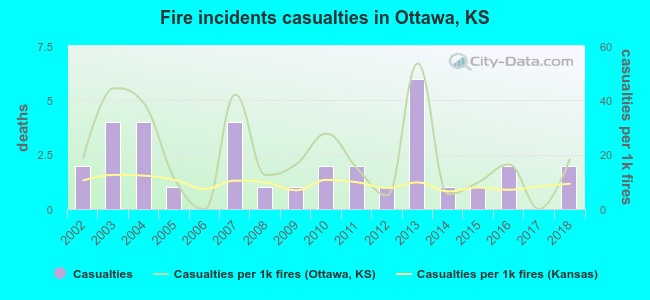 According to the reports from the years 2002 - 2018 the average number of fire-related yearly casualties is 2. The highest number of reported injuries - 6 took place in 2013, and the lowest - 0 in 2006. The data has a constant trend.
The average number of casualties per 1,000 fire incidents is 20. This indicator was the highest - 54 in 2013, and the lowest 0 in 2006. The trend for injuries per 1,000 incidents is dropping. Compared to the Kansas value the number of casualties per 1,000 incidents is higher.
According to the reports from the years 2002 - 2018 the average number of fire-related yearly casualties is 2. The highest number of reported injuries - 6 took place in 2013, and the lowest - 0 in 2006. The data has a constant trend.
The average number of casualties per 1,000 fire incidents is 20. This indicator was the highest - 54 in 2013, and the lowest 0 in 2006. The trend for injuries per 1,000 incidents is dropping. Compared to the Kansas value the number of casualties per 1,000 incidents is higher.Casualties per 1,000 incidents in Ottawa, KS compared to nearest cities:
(Note: Based on data for all years, including only cities with at least 500 fire incidents)
| Ottawa: | 17.8 |
| Baldwin City: | 5.7 |
| Wellsville: | 1.3 |
| Osawatomie: | 2.1 |
| Paola: | 5.4 |
| Lyndon: | 0.0 |
| Garnett: | 0.9 |
| Gardner: | 6.3 |
| Lawrence: | 10.4 |
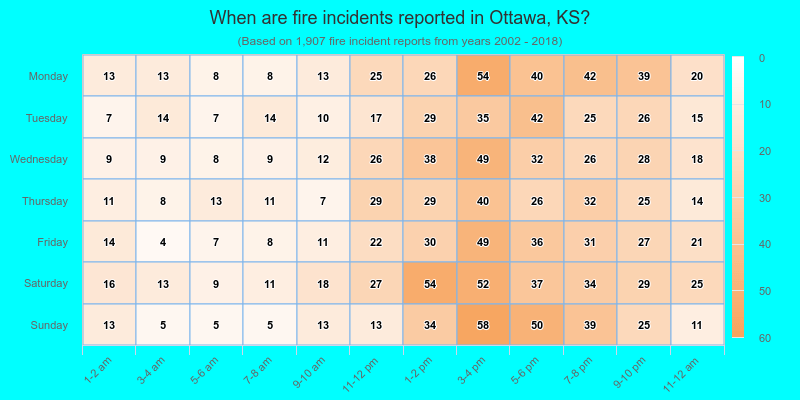
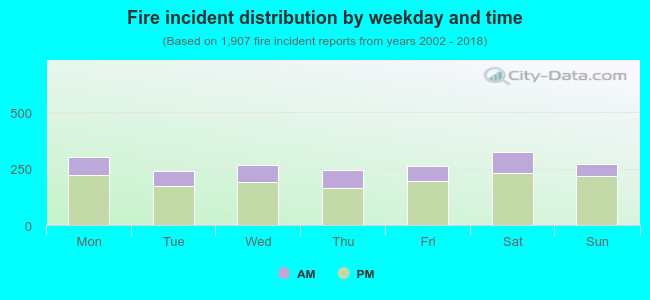 27.0% incidents where reported in the morning and 73.0% in the evening. The most fires (17.0%) took place on Saturday, and the least (12.6%) on Tuesday.
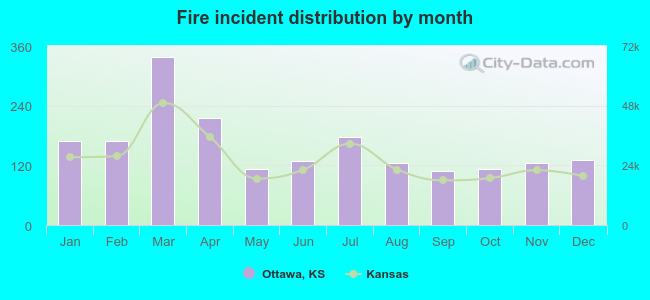 According to the 1,907 incident reports from years 2002 - 2018 most fires (17.7%) took place during March, and the least (5.7%) in September.
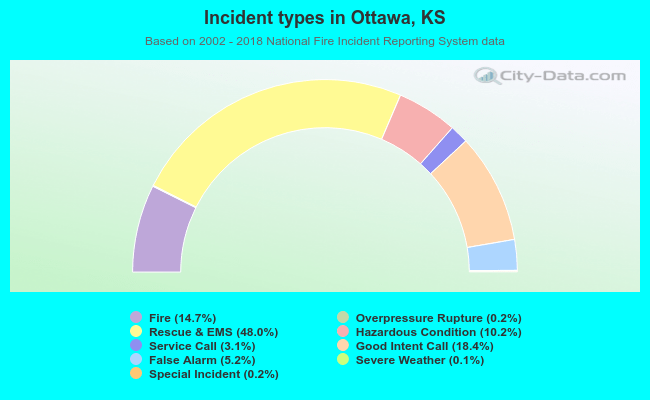 Out of all 12,954 cases reported during the years 2002 - 2018, the most belonged to the categories: Rescue & EMS (48.0%), Good Intent Call (18.4%), and Fire (14.7%).
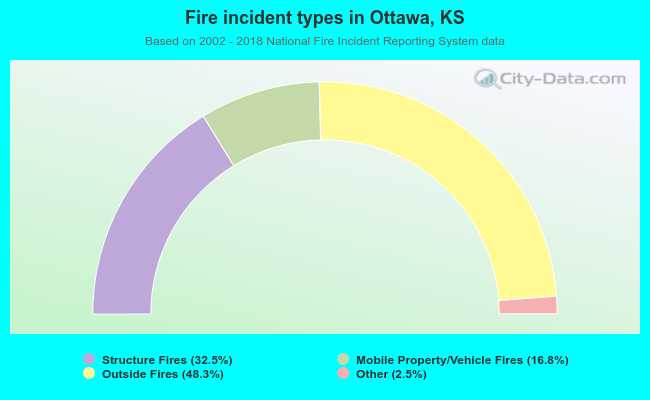 When looking into fire subcategories, the most reports belonged to: Outside Fires (48.3%), and Structure Fires (32.5%).