Gardner: Fire Incidents, Kansas (KS)
Where are fire incidents reported in Gardner, KS
Something went wrong! Please refresh the page.
| Fire incidents reported | |
|---|---|
| Sreet name | Count |
| SANTA FE | 98 |
| GARDNER RD | 90 |
| MAIN ST | 88 |
| MOONLIGHT RD | 76 |
| I-35 HWY | 66 |
| SANTA FE ST | 66 |
| CENTER ST | 58 |
| 151ST ST | 56 |
| 167TH ST | 50 |
| 159TH ST | 48 |
| 183RD ST | 36 |
| 191ST ST | 36 |
| CIMARRON TRL | 36 |
| 143RD ST | 34 |
| 175TH ST | 28 |
| 199TH ST | 28 |
| I35 HWY | 28 |
| OAK ST | 28 |
| ASPEN LN | 26 |
| PARK ST | 26 |
| PINE ST | 26 |
| WOODSON LN | 26 |
| CLARE RD | 24 |
| MADISON ST | 24 |
| ROSEWOOD ST | 24 |
| 183RD | 22 |
| HICKORY ST | 22 |
| SHAWNEE ST | 22 |
| BUFFALO TRL | 20 |
| EVERGREEN ST | 20 |
| Other | 41 |
2002 - 2018 National Fire Incident Reporting System (NFIRS) incidents
- Incident types reported to NFIRS in Gardner, KS
- 5,75054.3%Rescue & EMS
- 1,38413.1%Good Intent Call
- 1,27312.0%Fire
- 9749.2%Hazardous Condition
- 6065.7%False Alarm
- 5805.5%Service Call
- 130.1%Special Incident
- 110.1%Overpressure Rupture
- Fire incident types reported to NFIRS in Gardner, KS
- 55443.5%Structure Fires
- 49839.1%Outside Fires
- 17713.9%Mobile Property/Vehicle Fires
- 443.5%Other
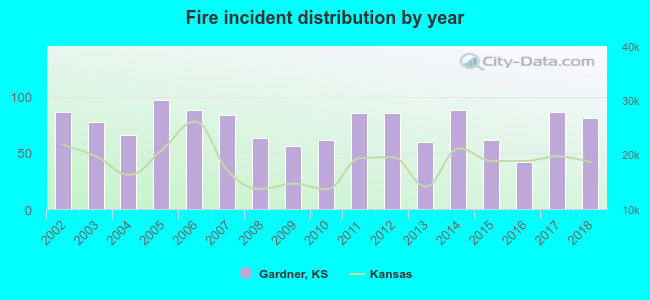 According to the data from the years 2002 - 2018 the average number of fire incidents per year is 75. The highest number of fires - 97 took place in 2005, and the least - 42 in 2016. The data has a declining trend.
The average number of yearly fire incidents per 10k residents in Gardner, KS compared to nearest cities:
(Note: Based on data for the last 3 years, including only cities with population 5,000 and above)
| Gardner: | 33.9 |
| Spring Hill: | 96.7 |
| Olathe: | 21.1 |
| De Soto: | 36.4 |
| Eudora: | 108.4 |
| Lenexa: | 30.4 |
| Overland Park: | 21.0 |
| Shawnee: | 23.6 |
| Paola: | 171.0 |
 The median response time based on all reported fire incidents is 6 minutes. This is comparable to the state median value.
The median response time in Gardner, KS compared to nearest cities:
(Note: Based on data for all years, including only cities with at least 500 fire incidents)
| Gardner: | 6 minutes |
| Spring Hill: | 7 minutes |
| Olathe: | 5 minutes |
| Wellsville: | 10 minutes |
| Eudora: | 8 minutes |
| Lenexa: | 5 minutes |
| Linwood: | 10 minutes |
| Baldwin City: | 9 minutes |
| Overland Park: | 6 minutes |
 According to the reports from the years 2002 - 2018 the average number of fire-related yearly deaths is 0. The highest number of reported deaths - 3 took place in 2008, and the lowest - 0 in 2002. The data has a constant trend.
 According to the reports from the years 2002 - 2018 the average number of fire-related yearly casualties is 0. The highest number of reported casualties - 4 took place in 2011, and the lowest - 0 in 2002. The data has a constant trend.
The average number of injuries per 1,000 fires is 6. This indicator was the highest - 47 in 2011, and the lowest 0 in 2002. The trend for casualties per 1,000 fire incidents is constant. Compared to the state value the number of injuries per 1,000 fire incidents is lower.
According to the reports from the years 2002 - 2018 the average number of fire-related yearly casualties is 0. The highest number of reported casualties - 4 took place in 2011, and the lowest - 0 in 2002. The data has a constant trend.
The average number of injuries per 1,000 fires is 6. This indicator was the highest - 47 in 2011, and the lowest 0 in 2002. The trend for casualties per 1,000 fire incidents is constant. Compared to the state value the number of injuries per 1,000 fire incidents is lower.Casualties per 1,000 incidents in Gardner, KS compared to nearest cities:
(Note: Based on data for all years, including only cities with at least 500 fire incidents)
| Gardner: | 6.3 |
| Spring Hill: | 14.0 |
| Olathe: | 17.6 |
| Wellsville: | 1.3 |
| Eudora: | 3.3 |
| Lenexa: | 17.0 |
| Linwood: | 0.0 |
| Baldwin City: | 5.7 |
| Overland Park: | 25.7 |
 30.5% incidents where reported in the morning and 69.5% in the evening. The most fires (16.5%) took place on Saturday, and the least (11.5%) on Wednesday.
 Based on the 1,273 fire incident reports from years 2002 - 2018 most fires (14.2%) took place during March, and the least (4.7%) in October.
 Out of all 10,595 cases reported during the years 2002 - 2018, the most belonged to the categories: Rescue & EMS (54.3%), Good Intent Call (13.1%), and Fire (12.0%).
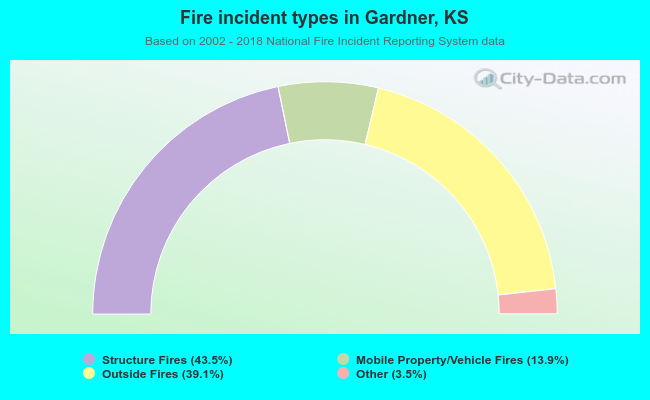 When looking into fire subcategories, the most reports belonged to: Structure Fires (43.5%), and Outside Fires (39.1%).