Othello: Fire Incidents, Washington (WA)
Where are fire incidents reported in Othello, WA
Something went wrong! Please refresh the page.
|
| |||||||||||||||||||||||||||||||||||||||||||||||||||||||||||||||||||||||||||||||||||||||||||||||||||||||||||||
| Other | 166 | |||||||||||||||||||||||||||||||||||||||||||||||||||||||||||||||||||||||||||||||||||||||||||||||||||||||||||||
2003 - 2018 National Fire Incident Reporting System (NFIRS) incidents
- Incident types reported to NFIRS in Othello, WA
- 1,23863.4%Fire
- 36418.6%Rescue & EMS
- 1507.7%Good Intent Call
- 1256.4%Hazardous Condition
- 412.1%False Alarm
- 311.6%Service Call
- 40.2%Special Incident
- Fire incident types reported to NFIRS in Othello, WA
- 79464.1%Outside Fires
- 19115.4%Structure Fires
- 16012.9%Mobile Property/Vehicle Fires
- 937.5%Other
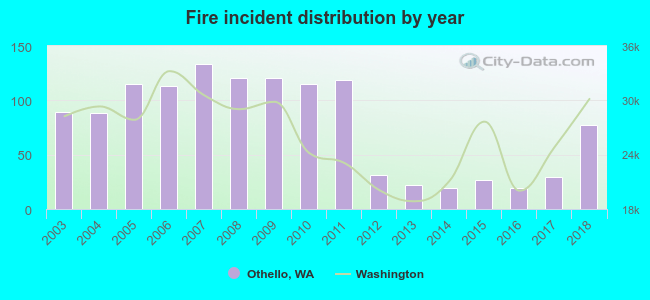 Based on the data from the years 2003 - 2018 the average number of fires per year is 77. The highest number of fire incidents - 133 took place in 2007, and the least - 19 in 2014. The data has a decreasing trend.
The average number of yearly fire incidents per 10k residents in Othello, WA compared to nearest cities:
(Note: Based on data for the last 3 years, including only cities with population 5,000 and above)
| Othello: | 54.1 |
| Connell: | 17.9 |
| Moses Lake: | 115.1 |
| West Richland: | 39.9 |
| Richland: | 34.6 |
| Ephrata: | 102.5 |
| Pasco: | 47.5 |
| Kennewick: | 54.0 |
| Quincy: | 126.9 |
 The median response time based on all reported fire incidents is 8 minutes. This is similar to the Washington median value.
The median response time in Othello, WA compared to nearest cities:
(Note: Based on data for all years, including only cities with at least 500 fire incidents)
| Othello: | 8 minutes |
| Moses Lake: | 8 minutes |
| Royal City: | 19 minutes |
| West Richland: | 8 minutes |
| Richland: | 6 minutes |
| Ephrata: | 10 minutes |
| Pasco: | 7 minutes |
| Benton City: | 9 minutes |
| Soap Lake: | 9 minutes |
 According to the reports from the years 2003 - 2018 the average number of fire-related yearly deaths is 0. The highest number of deaths - 1 took place in 2005, and the lowest - 0 in 2003. The data has a constant trend.
 26.2% incidents where reported in the morning and 73.8% in the evening. The most fires (16.5%) took place on Monday, and the least (13.2%) on Tuesday.
 According to the 1,238 fires from years 2003 - 2018 most fires (17.5%) took place during July, and the least (3.2%) in February.
 Out of all 1,954 cases reported during the years 2003 - 2018, the most belonged to the categories: Fire (63.4%), Overpressure Rupture (18.6%), and Service Call (7.7%).
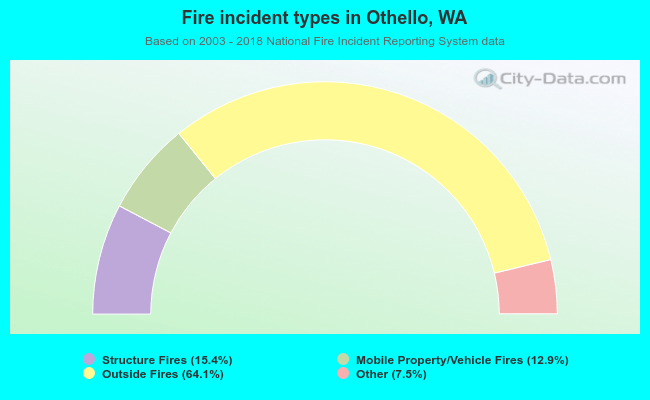 When looking into fire subcategories, the most reports belonged to: Outside Fires (64.1%), and Structure Fires (15.4%).