Kennewick: Fire Incidents, Washington (WA)
Where are fire incidents reported in Kennewick, WA
Something went wrong! Please refresh the page.
| Fire incidents reported | |
|---|---|
| Sreet name | Count |
| 10TH AVE | 382 |
| CLEARWATER AVE | 378 |
| FINLEY RD | 262 |
| 4TH AVE | 218 |
| CANAL DR | 212 |
| 7TH AVE | 210 |
| COLUMBIA CENTER BLVD | 202 |
| KENNEWICK AVE | 184 |
| SR 397 | 184 |
| 19TH AVE | 166 |
| HOOD AVE | 162 |
| EDISON ST | 152 |
| BOWLES RD | 150 |
| 240 HWY | 120 |
| COLUMBIA DR | 120 |
| ELY ST | 120 |
| OLYMPIA ST | 118 |
| 27TH AVE | 114 |
| ARTHUR ST | 112 |
| 6TH AVE | 102 |
| GUM ST | 102 |
| 1ST AVE | 96 |
| WASHINGTON ST | 94 |
| 5TH AVE | 92 |
| SR 397 HWY | 92 |
| BADGER RD | 90 |
| NINE CANYON RD | 88 |
| PERKINS RD | 88 |
| METALINE AVE | 86 |
| CLEVELAND ST | 84 |
| Other | 2,785 |
2002 - 2018 National Fire Incident Reporting System (NFIRS) incidents
- Incident types reported to NFIRS in Kennewick, WA
- 38,79862.7%Rescue & EMS
- 7,36511.9%Fire
- 7,31611.8%Good Intent Call
- 4,1546.7%Service Call
- 2,3453.8%False Alarm
- 1,7532.8%Hazardous Condition
- 1000.2%Special Incident
- Fire incident types reported to NFIRS in Kennewick, WA
- 3,24144.0%Outside Fires
- 2,87739.1%Structure Fires
- 96013.0%Mobile Property/Vehicle Fires
- 2873.9%Other
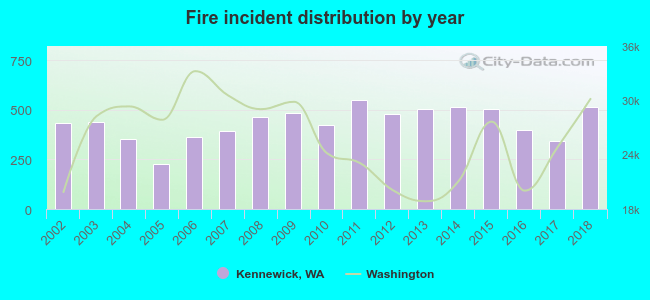 According to the data from the years 2002 - 2018 the average number of fires per year is 433. The highest number of fire incidents - 547 took place in 2011, and the least - 225 in 2005. The data has a growing trend.
The average number of yearly fire incidents per 10k residents in Kennewick, WA compared to nearest cities:
(Note: Based on data for the last 3 years, including only cities with population 5,000 and above)
| Kennewick: | 54.0 |
| Pasco: | 47.5 |
| Finley: | 8.3 |
| Richland: | 34.6 |
| West Richland: | 39.9 |
| Prosser: | 144.2 |
| Connell: | 17.9 |
| Grandview: | 44.6 |
| College Place: | 13.0 |
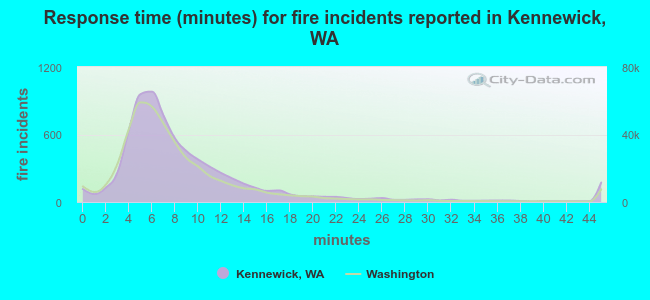 The median response time based on all reported fire incidents is 7 minutes. This is about the same as the Washington median value.
The median response time in Kennewick, WA compared to nearest cities:
(Note: Based on data for all years, including only cities with at least 500 fire incidents)
| Kennewick: | 7 minutes |
| Pasco: | 7 minutes |
| Burbank: | 9 minutes |
| Richland: | 6 minutes |
| West Richland: | 8 minutes |
| Benton City: | 9 minutes |
| Hermiston: | 7 minutes |
| Prosser: | 8 minutes |
| Echo: | 9 minutes |
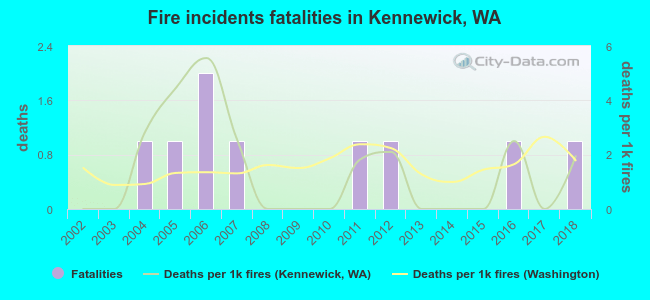 According to the data from the years 2002 - 2018 the average number of fire-related yearly deaths is 1. The highest number of reported deaths - 2 took place in 2006, and the lowest - 0 in 2002. The data has a rising trend.
The average number of fatalities per 1,000 fires is 1. This indicator was the highest - 6 in 2006, and the lowest 0 in 2002. The trend for deaths per 1,000 fire incidents is growing. Compared to the state value the number of deaths per 1,000 fires is lower.
According to the data from the years 2002 - 2018 the average number of fire-related yearly deaths is 1. The highest number of reported deaths - 2 took place in 2006, and the lowest - 0 in 2002. The data has a rising trend.
The average number of fatalities per 1,000 fires is 1. This indicator was the highest - 6 in 2006, and the lowest 0 in 2002. The trend for deaths per 1,000 fire incidents is growing. Compared to the state value the number of deaths per 1,000 fires is lower.
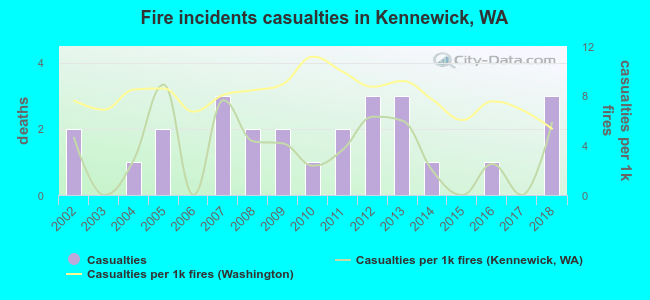 According to the data from the years 2002 - 2018 the average number of fire-related yearly casualties is 2. The highest number of casualties - 3 took place in 2007, and the lowest - 0 in 2003. The data has a rising trend.
The average number of casualties per 1,000 fires is 4. This indicator was the highest - 9 in 2005, and the lowest 0 in 2003. The trend for injuries per 1,000 fires is increasing. Compared to the state value the number of casualties per 1,000 incidents is much lower.
According to the data from the years 2002 - 2018 the average number of fire-related yearly casualties is 2. The highest number of casualties - 3 took place in 2007, and the lowest - 0 in 2003. The data has a rising trend.
The average number of casualties per 1,000 fires is 4. This indicator was the highest - 9 in 2005, and the lowest 0 in 2003. The trend for injuries per 1,000 fires is increasing. Compared to the state value the number of casualties per 1,000 incidents is much lower.Casualties per 1,000 incidents in Kennewick, WA compared to nearest cities:
(Note: Based on data for all years, including only cities with at least 500 fire incidents)
| Kennewick: | 3.5 |
| Pasco: | 4.9 |
| Burbank: | 3.3 |
| Richland: | 5.7 |
| West Richland: | 7.3 |
| Benton City: | 5.9 |
| Hermiston: | 11.4 |
| Prosser: | 0.0 |
| Echo: | 0.0 |
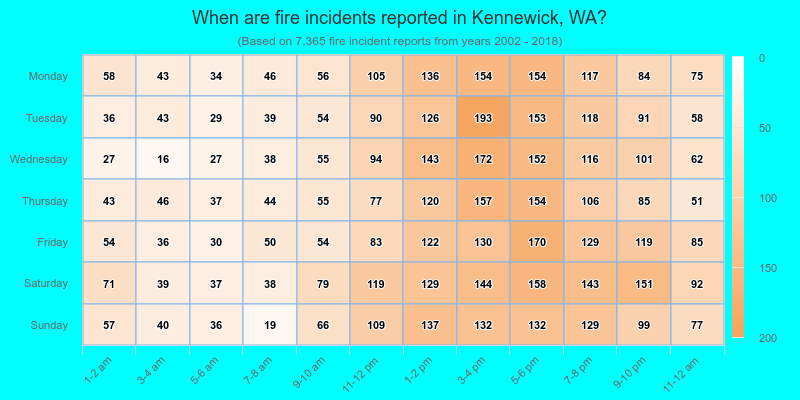
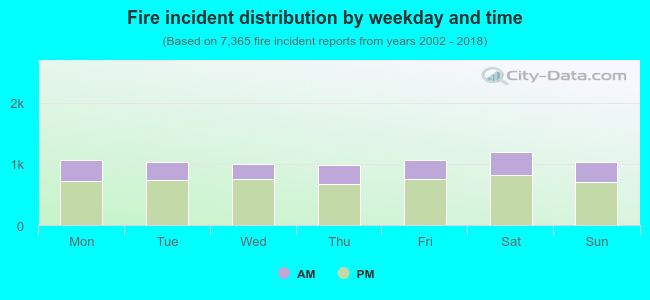 30.0% incidents where reported in the morning and 70.0% in the evening. The most fires (16.3%) took place on Saturday, and the least (13.2%) on Thursday.
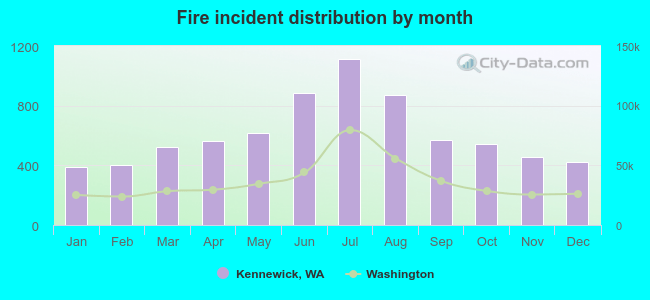 Based on the 7,365 fires from years 2002 - 2018 most fires (15.1%) took place during July, and the least (5.3%) in January.
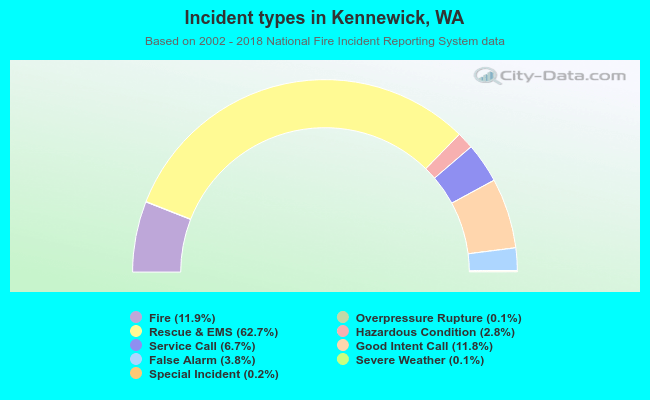 Out of all 61,901 cases reported during the years 2002 - 2018, the most belonged to the categories: Rescue & EMS (62.7%), Fire (11.9%), and Good Intent Call (11.8%).
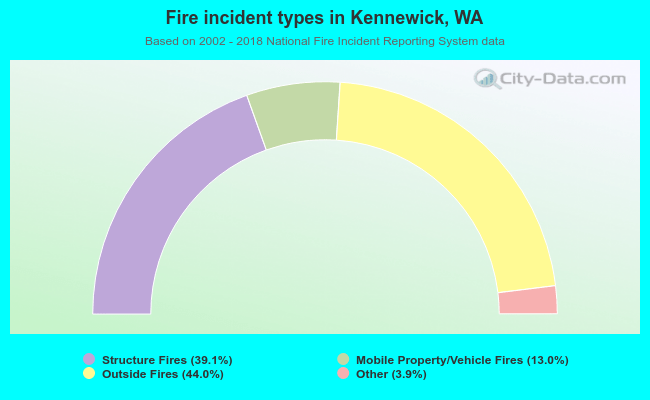 When looking into fire subcategories, the most reports belonged to: Outside Fires (44.0%), and Structure Fires (39.1%).