Old Lyme: Fire Incidents, Connecticut (CT)
Where are fire incidents reported in Old Lyme, CT
Something went wrong! Please refresh the page.
|
| |||||||||||||||||||||||||||||||||||||||||||||||||||||||||||||||||||||||||||||||||||||||||||||||||||||||||||||
2002 - 2018 National Fire Incident Reporting System (NFIRS) incidents
- Incident types reported to NFIRS in Old Lyme, CT
- 22024.4%Fire
- 21924.3%Hazardous Condition
- 21623.9%Rescue & EMS
- 17319.2%False Alarm
- 384.2%Service Call
- 333.7%Good Intent Call
- 20.2%Special Incident
- 10.1%Overpressure Rupture
- Fire incident types reported to NFIRS in Old Lyme, CT
- 11250.9%Structure Fires
- 5424.5%Outside Fires
- 4821.8%Mobile Property/Vehicle Fires
- 62.7%Other
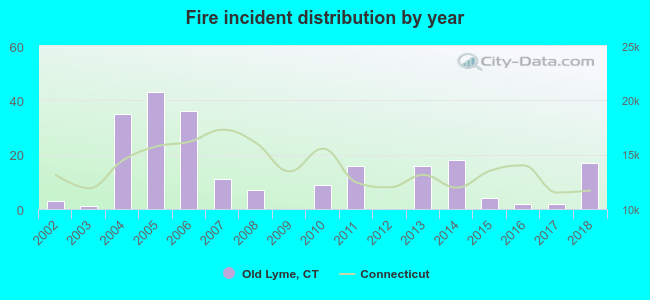 According to the data from the years 2002 - 2018 the average number of fire incidents per year is 13. The highest number of fire incidents - 43 took place in 2005, and the least - 0 in 2009. The data has a rising trend.
The average number of yearly fire incidents per 10k residents in Old Lyme, CT compared to nearest cities:
(Note: Based on data for the last 3 years, including only cities with population 5,000 and above)
| Old Lyme: | 9.2 |
| East Lyme: | 20.4 |
| Old Saybrook: | 66.7 |
| Essex: | 19.5 |
| Waterford: | 24.3 |
| Westbrook: | 32.7 |
| New London: | 56.0 |
| Groton: | 75.6 |
| Montville: | 19.2 |

 38.6% incidents where reported in the morning and 61.4% in the evening. The most fires (17.3%) took place on Saturday, and the least (10.9%) on Monday.
 Based on the 220 fire incidents from years 2002 - 2018 most fires (12.3%) took place during January, and the least (5.0%) in May.
 Out of all 902 cases reported during the years 2002 - 2018, the most belonged to the categories: Fire (24.4%), Hazardous Condition (24.3%), and Rescue & EMS (23.9%).
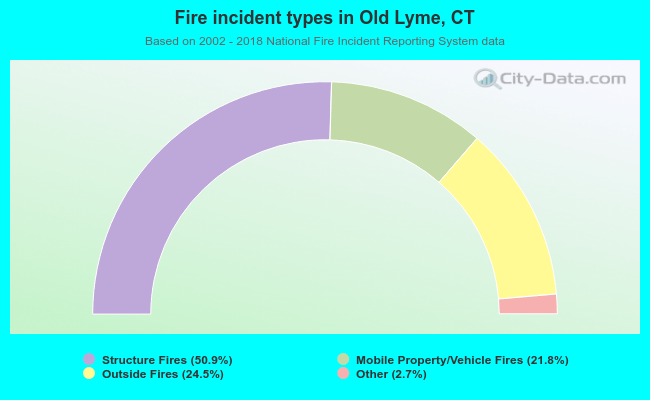 When looking into fire subcategories, the most reports belonged to: Structure Fires (50.9%), and Outside Fires (24.5%).