Groton: Fire Incidents, Connecticut (CT)
Where are fire incidents reported in Groton, CT
Something went wrong! Please refresh the page.
| Fire incidents reported | |
|---|---|
| Sreet name | Count |
| POQUONNOCK RD | 404 |
| LONG HILL RD | 242 |
| GOLD STAR HWY | 172 |
| ROUTE 12 | 142 |
| FORT HILL RD | 120 |
| NORTH RD | 116 |
| BRANFORD AVE | 88 |
| SOUTH RD | 86 |
| HAZELNUT HILL RD | 74 |
| MERIDIAN ST | 68 |
| THAMES ST | 66 |
| MICHELLE LANE | 56 |
| MATHER AVE | 52 |
| BUDDINGTON RD | 44 |
| DROZDYK DR | 44 |
| LEDGEWOOD RD | 44 |
| GOVERNORS CIR | 42 |
| GROTON LONG POINT RD | 42 |
| BRANDEGEE AVE | 40 |
| BENHAM RD | 36 |
| BRIDGE ST | 34 |
| MITCHELL ST | 32 |
| RING DR | 32 |
| EASTERN POINT RD | 30 |
| FLANDERS RD | 30 |
| PLAZA CT | 30 |
| SHENNECOSSETT RD | 30 |
| DEPOT RD | 28 |
| KINGS HWY | 28 |
| TOLLGATE RD | 28 |
2002 - 2018 National Fire Incident Reporting System (NFIRS) incidents
- Incident types reported to NFIRS in Groton, CT
- 7,98148.7%Rescue & EMS
- 3,18019.4%Hazardous Condition
- 2,17713.3%Fire
- 1,3978.5%False Alarm
- 8305.1%Good Intent Call
- 7854.8%Service Call
- 220.1%Overpressure Rupture
- Fire incident types reported to NFIRS in Groton, CT
- 1,17453.9%Structure Fires
- 65029.9%Outside Fires
- 32314.8%Mobile Property/Vehicle Fires
- 301.4%Other
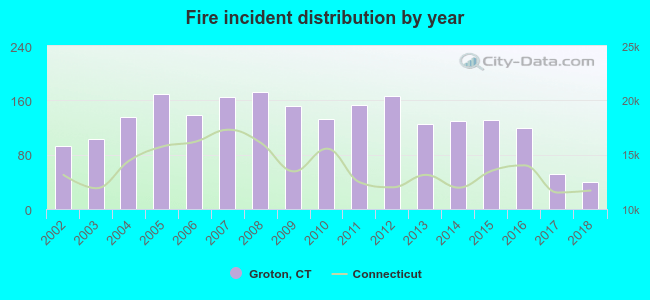 According to the data from the years 2002 - 2018 the average number of fires per year is 128. The highest number of fire incidents - 172 took place in 2008, and the least - 40 in 2018. The data has a decreasing trend.
The average number of yearly fire incidents per 10k residents in Groton, CT compared to nearest cities:
(Note: Based on data for the last 3 years, including only cities with population 5,000 and above)
| Groton: | 75.6 |
| New London: | 56.0 |
| Waterford: | 24.3 |
| Ledyard: | 22.6 |
| East Lyme: | 20.4 |
| Montville: | 19.2 |
| Old Lyme: | 9.2 |
| Pawcatuck: | 5.9 |
| North Stonington: | 49.1 |
 The median response time based on all reported fire incidents is 4 minutes. This is lower compared to the state median value.
The median response time in Groton, CT compared to nearest cities:
(Note: Based on data for all years, including only cities with at least 500 fire incidents)
| Groton: | 4 minutes |
| New London: | 4 minutes |
| Waterford: | 6 minutes |
| Mystic: | 5 minutes |
| Ledyard: | 9 minutes |
| East Lyme: | 6 minutes |
| Montville: | 7 minutes |
| Preston: | 8 minutes |
| North Stonington: | 10 minutes |
 According to the reports from the years 2002 - 2018 the average number of fire-related casualties per year is 3. The highest number of casualties - 9 took place in 2008, and the lowest - 0 in 2016. The data has a decreasing trend.
The average number of casualties per 1,000 fire incidents is 19. This indicator was the highest - 78 in 2003, and the lowest 0 in 2016. The trend for casualties per 1,000 incidents is decreasing. Compared to the state value the number of injuries per 1,000 fires is higher.
According to the reports from the years 2002 - 2018 the average number of fire-related casualties per year is 3. The highest number of casualties - 9 took place in 2008, and the lowest - 0 in 2016. The data has a decreasing trend.
The average number of casualties per 1,000 fire incidents is 19. This indicator was the highest - 78 in 2003, and the lowest 0 in 2016. The trend for casualties per 1,000 incidents is decreasing. Compared to the state value the number of injuries per 1,000 fires is higher.Casualties per 1,000 incidents in Groton, CT compared to nearest cities:
(Note: Based on data for all years, including only cities with at least 500 fire incidents)
| Groton: | 20.2 |
| New London: | 33.9 |
| Waterford: | 15.9 |
| Mystic: | 8.9 |
| Ledyard: | 14.5 |
| East Lyme: | 2.9 |
| Montville: | 4.5 |
| Preston: | 0.0 |
| North Stonington: | 0.0 |
 30.8% incidents where reported in the morning and 69.2% in the evening. The most fires (15.4%) took place on Sunday, and the least (13.3%) on Thursday.
 According to the 2,177 fire incidents from years 2002 - 2018 most fires (11.4%) took place during April, and the least (6.4%) in December.
 Out of all 16,386 cases reported during the years 2002 - 2018, the most belonged to the categories: Rescue & EMS (48.7%), Hazardous Condition (19.4%), and Fire (13.3%).
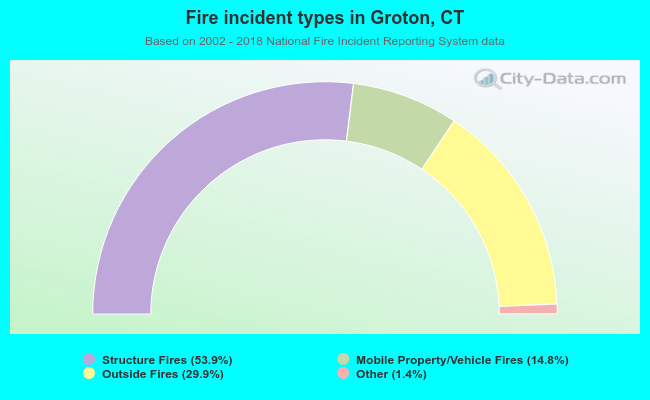 When looking into fire subcategories, the most reports belonged to: Structure Fires (53.9%), and Outside Fires (29.9%).