Oakville: Fire Incidents, Missouri (MO)
Where are fire incidents reported in Oakville, MO
Something went wrong! Please refresh the page.
|
| |||||||||||||||||||||||||||||||||||||||||||||||||||||||||||||||||||||||||||||||||||||||||||||||||||||||||||||
2009 - 2018 National Fire Incident Reporting System (NFIRS) incidents
- Incident types reported to NFIRS in Oakville, MO
- 12233.0%Fire
- 10829.2%Hazardous Condition
- 9124.6%Rescue & EMS
- 174.6%Service Call
- 164.3%False Alarm
- 143.8%Good Intent Call
- 10.3%Overpressure Rupture
- 10.3%Severe Weather
- Fire incident types reported to NFIRS in Oakville, MO
- 4839.3%Outside Fires
- 4738.5%Structure Fires
- 1512.3%Mobile Property/Vehicle Fires
- 129.8%Other
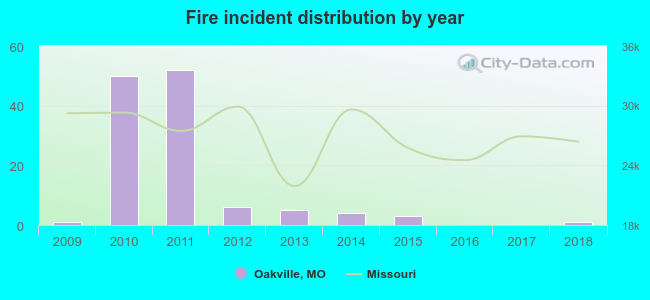 Based on the data from the years 2009 - 2018 the average number of fires per year is 12. The highest number of fire incidents - 52 took place in 2011, and the least - 0 in 2016. The data has a constant trend.
The average number of yearly fire incidents per 10k residents in Oakville, MO compared to nearest cities:
(Note: Based on data for the last 3 years, including only cities with population 5,000 and above)
| Oakville: | 0.3 |
| Mehlville: | 1.2 |
| Arnold: | 17.4 |
| Lemay: | 10.8 |
| Affton: | 8.9 |
| Sunset Hills: | 39.5 |
| Crestwood: | 22.6 |
| Shrewsbury: | 28.5 |
| Webster Groves: | 24.9 |

 27.9% incidents where reported in the morning and 72.1% in the evening. The most fires (19.7%) took place on Monday, and the least (11.5%) on Tuesday.
 According to the 122 incident reports from years 2009 - 2018 most fires (15.6%) took place during November, and the least (3.3%) in March.
 Out of all 370 cases reported during the years 2009 - 2018, the most belonged to the categories: Fire (33.0%), Hazardous Condition (29.2%), and Rescue & EMS (24.6%).
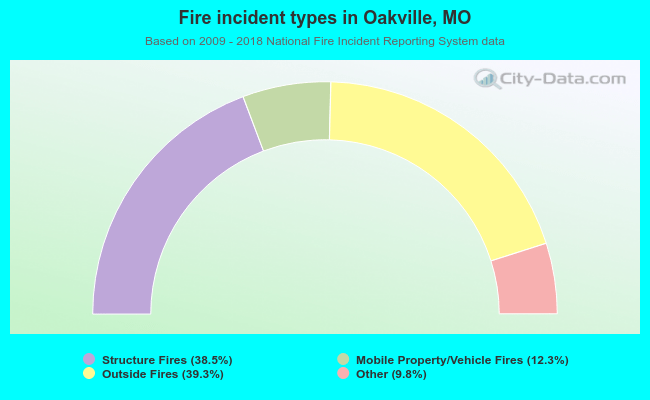 When looking into fire subcategories, the most reports belonged to: Outside Fires (39.3%), and Structure Fires (38.5%).