Affton: Fire Incidents, Missouri (MO)
Where are fire incidents reported in Affton, MO
Something went wrong! Please refresh the page.
|
| |||||||||||||||||||||||||||||||||||||||||||||||||||||||||||||||||||||||||||||||||||||||||||||||||||||||||||||
| Other | 107 | |||||||||||||||||||||||||||||||||||||||||||||||||||||||||||||||||||||||||||||||||||||||||||||||||||||||||||||
2004 - 2018 National Fire Incident Reporting System (NFIRS) incidents
- Incident types reported to NFIRS in Affton, MO
- 1,07331.4%Rescue & EMS
- 89726.3%Fire
- 88425.9%Hazardous Condition
- 2858.3%Good Intent Call
- 1534.5%Service Call
- 922.7%False Alarm
- 260.8%Special Incident
- Fire incident types reported to NFIRS in Affton, MO
- 42046.8%Structure Fires
- 31234.8%Outside Fires
- 9010.0%Other
- 758.4%Mobile Property/Vehicle Fires
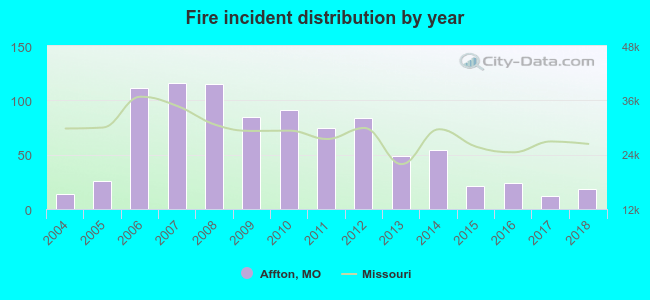 Based on the data from the years 2004 - 2018 the average number of fire incidents per year is 60. The highest number of fire incidents - 116 took place in 2007, and the least - 12 in 2017. The data has a growing trend.
The average number of yearly fire incidents per 10k residents in Affton, MO compared to nearest cities:
(Note: Based on data for the last 3 years, including only cities with population 5,000 and above)
| Affton: | 8.9 |
| Lemay: | 10.8 |
| Shrewsbury: | 28.5 |
| Crestwood: | 22.6 |
| Webster Groves: | 24.9 |
| Mehlville: | 1.2 |
| Maplewood: | 75.0 |
| Glendale: | 11.3 |
| Sunset Hills: | 39.5 |
 The median response time based on all reported fire incidents is 5 minutes. This is lower than the Missouri median value.
The median response time in Affton, MO compared to nearest cities:
(Note: Based on data for all years, including only cities with at least 500 fire incidents)
| Affton: | 5 minutes |
| Lemay: | 6 minutes |
| Shrewsbury: | 5 minutes |
| Crestwood: | 4 minutes |
| Webster Groves: | 5 minutes |
| Maplewood: | 4 minutes |
| Sunset Hills: | 5 minutes |
| Brentwood: | 4 minutes |
| Kirkwood: | 5 minutes |
 30.1% incidents where reported in the morning and 69.9% in the evening. The most fires (15.3%) took place on Monday, and the least (13.0%) on Friday.
 Based on the 897 reports from years 2004 - 2018 most fires (12.8%) took place during March, and the least (6.4%) in May.
 Out of all 3,414 cases reported during the years 2004 - 2018, the most belonged to the categories: Rescue & EMS (31.4%), Fire (26.3%), and Hazardous Condition (25.9%).
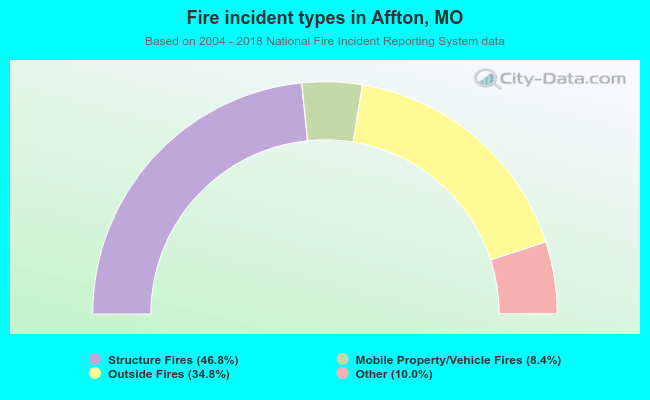 When looking into fire subcategories, the most reports belonged to: Structure Fires (46.8%), and Outside Fires (34.8%).