Northport: Fire Incidents, Alabama (AL)
Where are fire incidents reported in Northport, AL
Something went wrong! Please refresh the page.
| Fire incidents reported | |
|---|---|
| Sreet name | Count |
| MCFARLAND BLVD | 795 |
| WATERMELON RD | 221 |
| ENERGY CENTER BLVD | 140 |
| 43 HWY | 135 |
| MAIN AVE | 125 |
| 69 HWY | 120 |
| MARTIN RD | 98 |
| UNION CHAPEL RD | 95 |
| HARPER RD | 90 |
| SNOW MILLS AVE | 80 |
| 26TH AVE | 75 |
| 17TH ST | 70 |
| HUNTER CREEK RD | 70 |
| 24TH ST | 65 |
| 5TH ST | 65 |
| 30TH AVE | 60 |
| 32ND ST | 60 |
| BRIDGE AVE | 60 |
| HWY 171 HWY | 60 |
| NORTHWOOD LAKE DR | 60 |
| CHARLIE SHIRLEY RD | 55 |
| LURLEEN B WALLACE BLVD | 55 |
| 34TH AVE | 50 |
| HWY 43 HWY | 50 |
| 20TH ST | 45 |
| DEERFIELD DR | 45 |
| 12TH ST | 40 |
| 171 HWY | 40 |
| BAPTIST CAMP GROUND RD | 40 |
| FLATWOODS RD | 40 |
2003 - 2018 National Fire Incident Reporting System (NFIRS) incidents
- Incident types reported to NFIRS in Northport, AL
- 9,00067.4%Rescue & EMS
- 1,70812.8%Fire
- 9357.0%Service Call
- 7115.3%False Alarm
- 4823.6%Good Intent Call
- 4683.5%Hazardous Condition
- 270.2%Special Incident
- Fire incident types reported to NFIRS in Northport, AL
- 76845.0%Outside Fires
- 51129.9%Structure Fires
- 24714.5%Mobile Property/Vehicle Fires
- 18210.7%Other
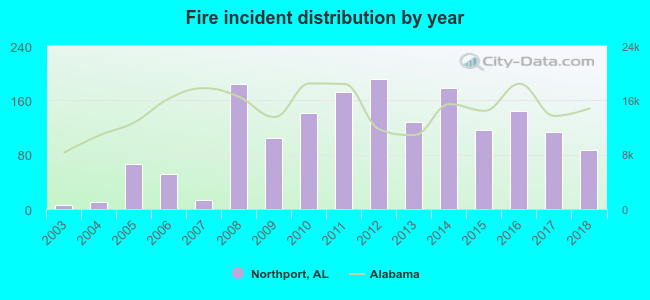 Based on the data from the years 2003 - 2018 the average number of fire incidents per year is 107. The highest number of reported fire incidents - 191 took place in 2012, and the least - 6 in 2003. The data has an increasing trend.
The average number of yearly fire incidents per 10k residents in Northport, AL compared to nearest cities:
(Note: Based on data for the last 3 years, including only cities with population 5,000 and above)
| Northport: | 46.5 |
| Tuscaloosa: | 25.9 |
| Abernant: | 1.3 |
| Hueytown: | 27.8 |
| Bessemer: | 92.8 |
| Pleasant Grove: | 30.3 |
| Midfield: | 63.3 |
| Fairfield: | 8.2 |
| Helena: | 3.4 |
 The median response time based on all reported fire incidents is 5 minutes. This is lower than the state median value.
The median response time in Northport, AL compared to nearest cities:
(Note: Based on data for all years, including only cities with at least 500 fire incidents)
| Northport: | 5 minutes |
| Tuscaloosa: | 5 minutes |
| Fayette: | 6 minutes |
| Parrish: | 10 minutes |
| Bessemer: | 5 minutes |
| Pleasant Grove: | 4 minutes |
| Midfield: | 5 minutes |
| Adamsville: | 5 minutes |
 Based on the data from the years 2003 - 2018 the average number of fire-related yearly casualties is 1. The highest number of reported injuries - 3 took place in 2018, and the lowest - 0 in 2003. The data has an increasing trend.
The average number of casualties per 1,000 fire incidents is 12. This indicator was the highest - 77 in 2007, and the lowest 0 in 2003. The trend for injuries per 1,000 incidents is growing. Compared to the state value the number of casualties per 1,000 incidents is higher.
Based on the data from the years 2003 - 2018 the average number of fire-related yearly casualties is 1. The highest number of reported injuries - 3 took place in 2018, and the lowest - 0 in 2003. The data has an increasing trend.
The average number of casualties per 1,000 fire incidents is 12. This indicator was the highest - 77 in 2007, and the lowest 0 in 2003. The trend for injuries per 1,000 incidents is growing. Compared to the state value the number of casualties per 1,000 incidents is higher.Casualties per 1,000 incidents in Northport, AL compared to nearest cities:
(Note: Based on data for all years, including only cities with at least 500 fire incidents)
| Northport: | 7.0 |
| Tuscaloosa: | 12.5 |
| Fayette: | 1.3 |
| Parrish: | 2.9 |
| Bessemer: | 5.0 |
| Pleasant Grove: | 5.3 |
| Midfield: | 0.0 |
| Adamsville: | 15.6 |
 28.3% incidents where reported in the morning and 71.7% in the evening. The most fires (15.8%) took place on Saturday, and the least (12.5%) on Thursday.
 According to the 1,708 incident reports from years 2003 - 2018 most fires (10.8%) took place during January, and the least (5.9%) in September.
 Out of all 13,347 cases reported during the years 2003 - 2018, the most belonged to the categories: Rescue & EMS (67.4%), Fire (12.8%), and Service Call (7.0%).
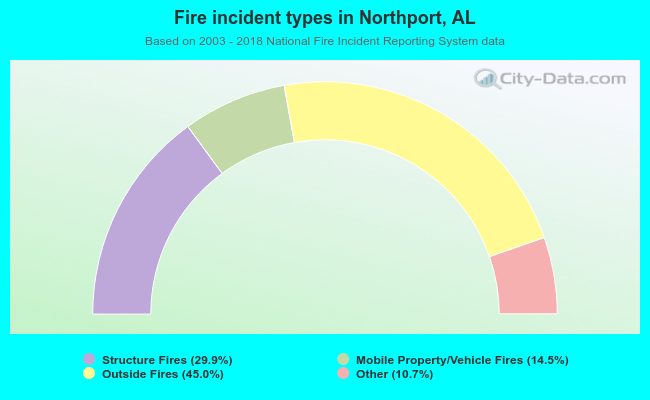 When looking into fire subcategories, the most incidents belonged to: Outside Fires (45.0%), and Structure Fires (29.9%).