Normal: Fire Incidents, Illinois (IL)
Where are fire incidents reported in Normal, IL
Something went wrong! Please refresh the page.
| Fire incidents reported | |
|---|---|
| Sreet name | Count |
| COLLEGE AVE | 202 |
| MAIN ST | 196 |
| FELL AVE | 176 |
| LINDEN ST | 144 |
| WILLOW ST | 122 |
| RAAB RD | 112 |
| CHERRY ST | 108 |
| SCHOOL ST | 106 |
| VERNON AVE | 98 |
| LOCUST ST | 92 |
| ORLANDO AVE | 86 |
| UNIVERSITY ST | 78 |
| ADELAIDE ST | 76 |
| HOVEY AVE | 52 |
| VETERANS PKY | 46 |
| PARKSIDE RD | 42 |
| WHITE OAK RD | 42 |
| BROADWAY ST | 40 |
| FRANKLIN AVE | 38 |
| HESTER AVE | 38 |
| MULBERRY ST | 38 |
| KINGSLEY ST | 36 |
| ORLANDO | 36 |
| TRADERS CIR | 36 |
| TOWANDA AVE | 34 |
| GREGORY ST | 32 |
| SHELBOURNE DR | 30 |
| NORTHFIELD DR | 28 |
| GREENBRIAR DR | 26 |
| OAK ST | 26 |
2003 - 2018 National Fire Incident Reporting System (NFIRS) incidents
- Incident types reported to NFIRS in Normal, IL
- 15,01468.1%Rescue & EMS
- 2,0489.3%Hazardous Condition
- 1,9889.0%False Alarm
- 1,9608.9%Fire
- 4992.3%Service Call
- 4422.0%Good Intent Call
- 400.2%Overpressure Rupture
- 330.1%Severe Weather
- Fire incident types reported to NFIRS in Normal, IL
- 92547.2%Outside Fires
- 69935.7%Structure Fires
- 24412.4%Mobile Property/Vehicle Fires
- 924.7%Other
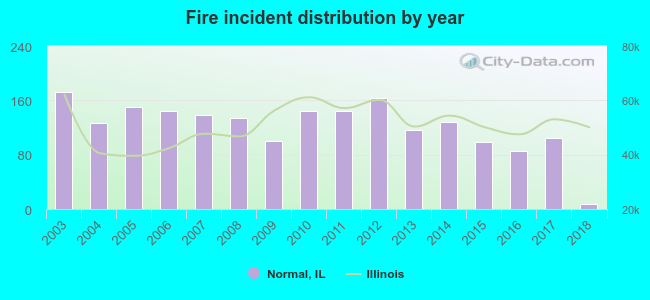 According to the data from the years 2003 - 2018 the average number of fire incidents per year is 122. The highest number of reported fires - 172 took place in 2003, and the least - 8 in 2018. The data has a declining trend.
The average number of yearly fire incidents per 10k residents in Normal, IL compared to nearest cities:
(Note: Based on data for the last 3 years, including only cities with population 5,000 and above)
| Normal: | 12.2 |
| Bloomington: | 28.6 |
| Eureka: | 23.6 |
| Clinton: | 133.3 |
| Morton: | 18.6 |
| Washington: | 44.0 |
| East Peoria: | 31.7 |
| Pontiac: | 58.9 |
| Lincoln: | 103.6 |
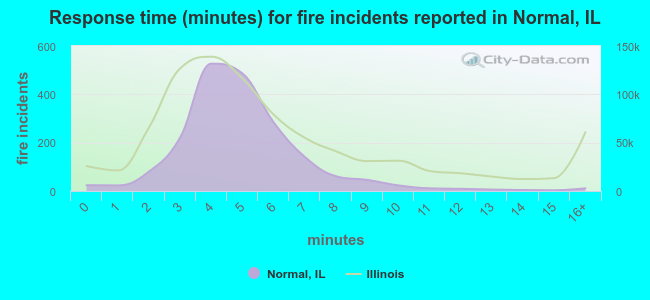 The median response time based on all reported fire incidents is 5 minutes. This is close to the state median value.
The median response time in Normal, IL compared to nearest cities:
(Note: Based on data for all years, including only cities with at least 500 fire incidents)
| Normal: | 5 minutes |
| Bloomington: | 5 minutes |
| Clinton: | 8 minutes |
| Morton: | 8 minutes |
| Washington: | 7 minutes |
| Metamora: | 8 minutes |
| East Peoria: | 5 minutes |
| Pontiac: | 10 minutes |
| Lincoln: | 5 minutes |
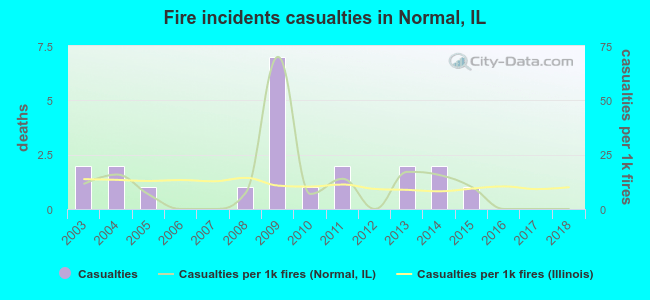 Based on the reports from the years 2003 - 2018 the average number of fire-related casualties per year is 1. The highest number of reported injuries - 7 took place in 2009, and the lowest - 0 in 2006. The data has a decreasing trend.
The average number of casualties per 1,000 fires is 11. This indicator was the highest - 70 in 2009, and the lowest 0 in 2006. The trend for casualties per 1,000 fire incidents is declining. Compared to the Illinois value the number of injuries per 1,000 fire incidents is similar.
Based on the reports from the years 2003 - 2018 the average number of fire-related casualties per year is 1. The highest number of reported injuries - 7 took place in 2009, and the lowest - 0 in 2006. The data has a decreasing trend.
The average number of casualties per 1,000 fires is 11. This indicator was the highest - 70 in 2009, and the lowest 0 in 2006. The trend for casualties per 1,000 fire incidents is declining. Compared to the Illinois value the number of injuries per 1,000 fire incidents is similar.Casualties per 1,000 incidents in Normal, IL compared to nearest cities:
(Note: Based on data for all years, including only cities with at least 500 fire incidents)
| Normal: | 10.7 |
| Bloomington: | 20.8 |
| Clinton: | 5.0 |
| Morton: | 29.1 |
| Washington: | 8.7 |
| Metamora: | 1.9 |
| East Peoria: | 12.3 |
| Pontiac: | 10.8 |
| Lincoln: | 15.2 |
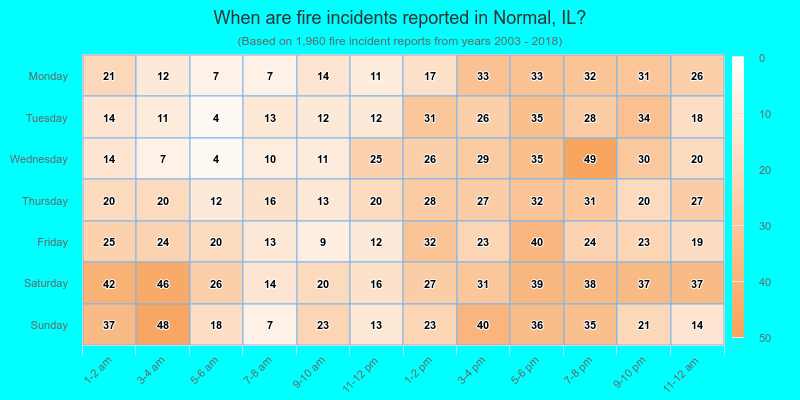
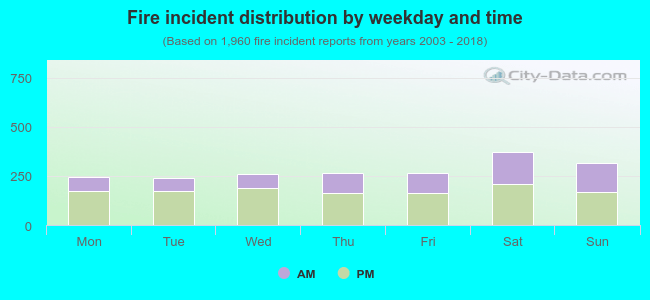 36.9% incidents where reported in the morning and 63.1% in the evening. The most fires (19.0%) took place on Saturday, and the least (12.1%) on Tuesday.
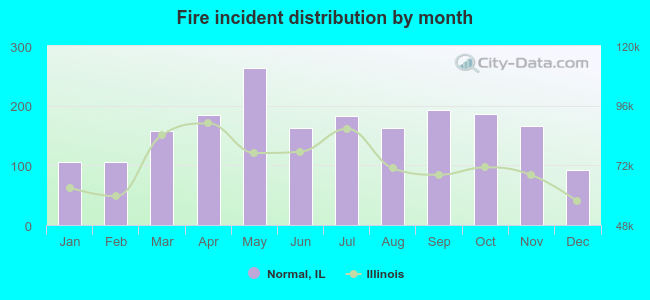 Based on the 1,960 reports from years 2003 - 2018 most fires (13.4%) took place during May, and the least (4.7%) in December.
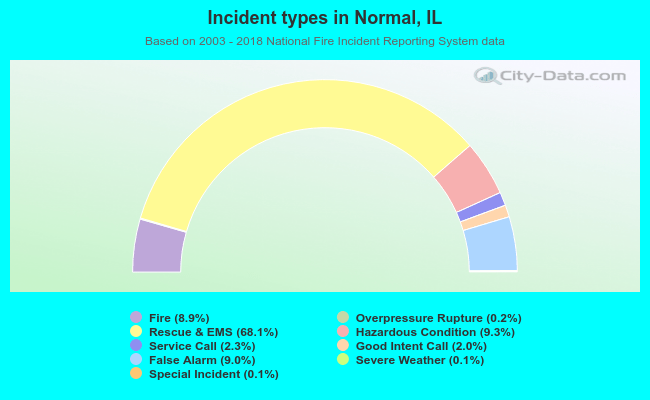 Out of all 22,043 cases reported during the years 2003 - 2018, the most belonged to the categories: Rescue & EMS (68.1%), Hazardous Condition (9.3%), and False Alarm (9.0%).
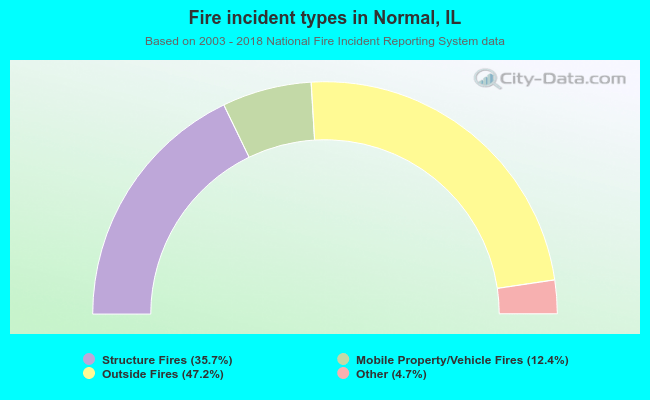 When looking into fire subcategories, the most reports belonged to: Outside Fires (47.2%), and Structure Fires (35.7%).