Bloomington: Fire Incidents, Illinois (IL)
Where are fire incidents reported in Bloomington, IL
Something went wrong! Please refresh the page.
| Fire incidents reported | |
|---|---|
| Sreet name | Count |
| WASHINGTON ST | 226 |
| MARKET ST | 212 |
| MAIN ST | 170 |
| EMPIRE ST | 146 |
| OAKLAND AVE | 124 |
| LOCUST ST | 120 |
| MORRIS AVE | 118 |
| JEFFERSON ST | 98 |
| HERSHEY RD | 96 |
| GROVE ST | 90 |
| MULBERRY ST | 84 |
| CHESTNUT ST | 78 |
| VETERANS | 78 |
| TRACY DR | 74 |
| WOOD ST | 74 |
| OLIVE ST | 68 |
| FRONT ST | 66 |
| SPRINGFIELD RD | 66 |
| LEE ST | 64 |
| MACARTHUR AVE | 64 |
| MORRISSEY DR | 62 |
| MONROE ST | 56 |
| TODD DR | 56 |
| JACKSON ST | 54 |
| RAINBOW AVE | 54 |
| ROOSEVELT AVE | 54 |
| INTERSTATE 74 | 52 |
| VETERANS PKY | 52 |
| EAST ST | 50 |
| MASON ST | 50 |
| Other | 1,093 |
2003 - 2018 National Fire Incident Reporting System (NFIRS) incidents
- Incident types reported to NFIRS in Bloomington, IL
- 33,67465.5%Rescue & EMS
- 4,5658.9%Hazardous Condition
- 3,8177.4%False Alarm
- 3,7497.3%Fire
- 2,8075.5%Service Call
- 2,6955.2%Good Intent Call
- 710.1%Overpressure Rupture
- Fire incident types reported to NFIRS in Bloomington, IL
- 1,69745.3%Structure Fires
- 1,43438.3%Outside Fires
- 56915.2%Mobile Property/Vehicle Fires
- 491.3%Other
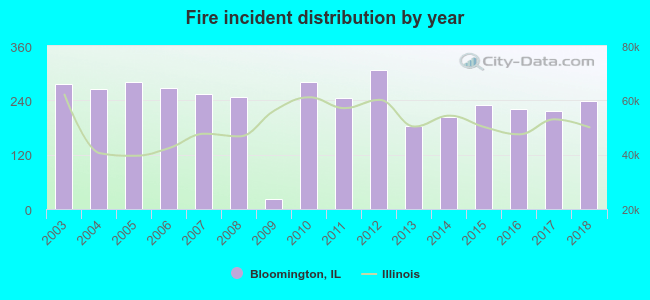 Based on the data from the years 2003 - 2018 the average number of fires per year is 234. The highest number of fires - 308 took place in 2012, and the least - 22 in 2009. The data has a declining trend.
The average number of yearly fire incidents per 10k residents in Bloomington, IL compared to nearest cities:
(Note: Based on data for the last 3 years, including only cities with population 5,000 and above)
| Bloomington: | 28.6 |
| Normal: | 12.2 |
| Eureka: | 23.6 |
| Clinton: | 133.3 |
| Morton: | 18.6 |
| Washington: | 44.0 |
| Lincoln: | 103.6 |
| East Peoria: | 31.7 |
| Pontiac: | 58.9 |
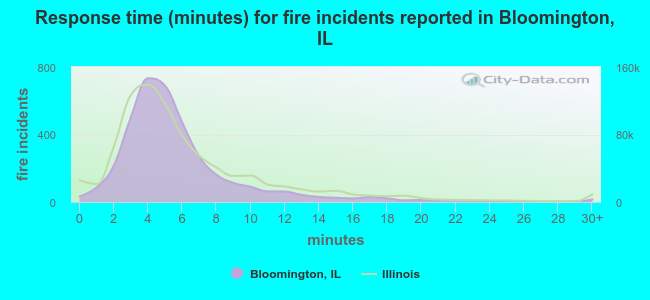 The median response time based on all reported fire incidents is 5 minutes. This is comparable to the state median value.
The median response time in Bloomington, IL compared to nearest cities:
(Note: Based on data for all years, including only cities with at least 500 fire incidents)
| Bloomington: | 5 minutes |
| Normal: | 5 minutes |
| Clinton: | 8 minutes |
| Morton: | 8 minutes |
| Washington: | 7 minutes |
| Metamora: | 8 minutes |
| Lincoln: | 5 minutes |
| East Peoria: | 5 minutes |
| Pontiac: | 10 minutes |
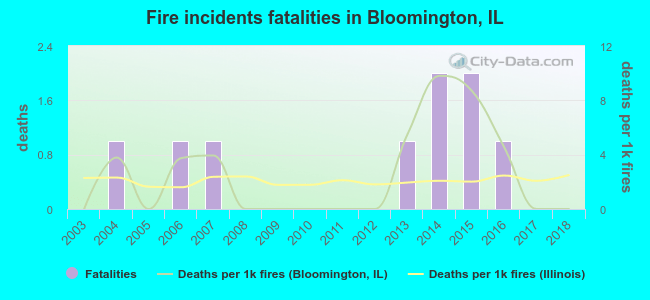 According to the reports from the years 2003 - 2018 the average number of fire-related fatalities per year is 1. The highest number of reported deaths - 2 took place in 2014, and the lowest - 0 in 2003. The data has a constant trend.
The average number of fatalities per 1,000 fires is 2. This indicator was the highest - 10 in 2014, and the lowest 0 in 2003. The trend for deaths per 1,000 fires is declining. Compared to the state value the number of deaths per 1,000 fires is about the same.
According to the reports from the years 2003 - 2018 the average number of fire-related fatalities per year is 1. The highest number of reported deaths - 2 took place in 2014, and the lowest - 0 in 2003. The data has a constant trend.
The average number of fatalities per 1,000 fires is 2. This indicator was the highest - 10 in 2014, and the lowest 0 in 2003. The trend for deaths per 1,000 fires is declining. Compared to the state value the number of deaths per 1,000 fires is about the same.Deaths per 1,000 incidents in Bloomington, IL compared to nearest cities:
(Note: Based on data for all years, including only cities with at least 2,500 fire incidents)
| Bloomington: | 2.4 |
| Pekin: | 4.7 |
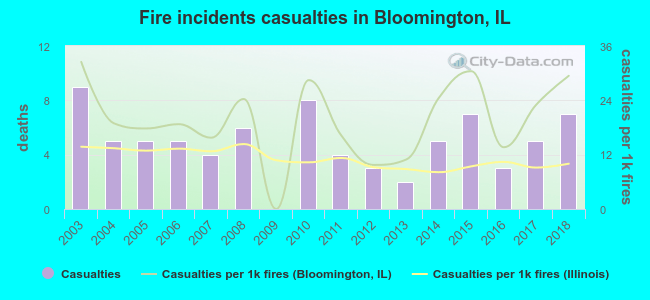 Based on the reports from the years 2003 - 2018 the average number of fire-related yearly casualties is 5. The highest number of casualties - 9 took place in 2003, and the lowest - 0 in 2009. The data has a declining trend.
The average number of casualties per 1,000 fires is 20. This indicator was the highest - 32 in 2003, and the lowest 0 in 2009. The trend for casualties per 1,000 incidents is declining. Compared to the state value the number of casualties per 1,000 incidents is higher.
Based on the reports from the years 2003 - 2018 the average number of fire-related yearly casualties is 5. The highest number of casualties - 9 took place in 2003, and the lowest - 0 in 2009. The data has a declining trend.
The average number of casualties per 1,000 fires is 20. This indicator was the highest - 32 in 2003, and the lowest 0 in 2009. The trend for casualties per 1,000 incidents is declining. Compared to the state value the number of casualties per 1,000 incidents is higher.Casualties per 1,000 incidents in Bloomington, IL compared to nearest cities:
(Note: Based on data for all years, including only cities with at least 500 fire incidents)
| Bloomington: | 20.8 |
| Normal: | 10.7 |
| Clinton: | 5.0 |
| Morton: | 29.1 |
| Washington: | 8.7 |
| Metamora: | 1.9 |
| Lincoln: | 15.2 |
| East Peoria: | 12.3 |
| Pontiac: | 10.8 |
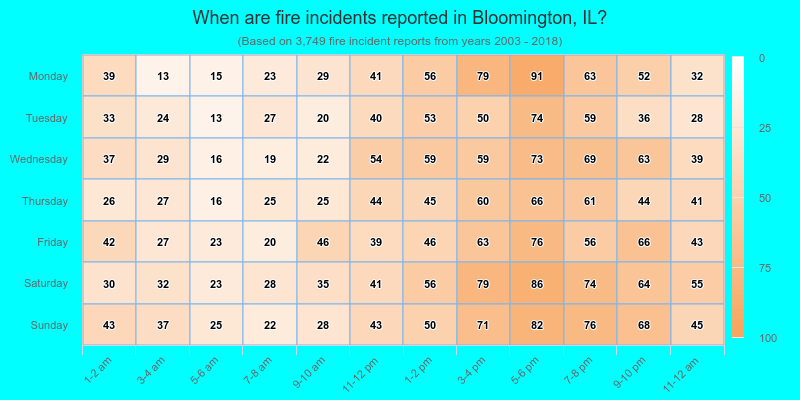
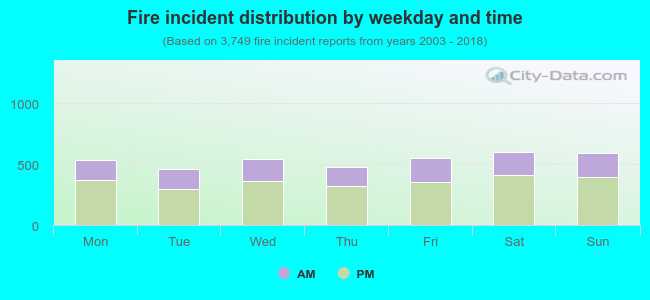 33.1% incidents where reported in the morning and 66.9% in the evening. The most fires (16.1%) took place on Saturday, and the least (12.2%) on Tuesday.
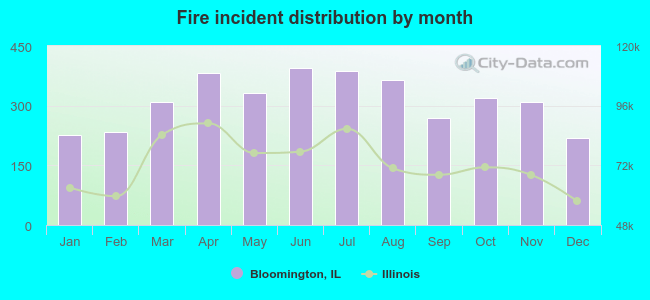 According to the 3,749 fire incidents from years 2003 - 2018 most fires (10.5%) took place during June, and the least (5.8%) in December.
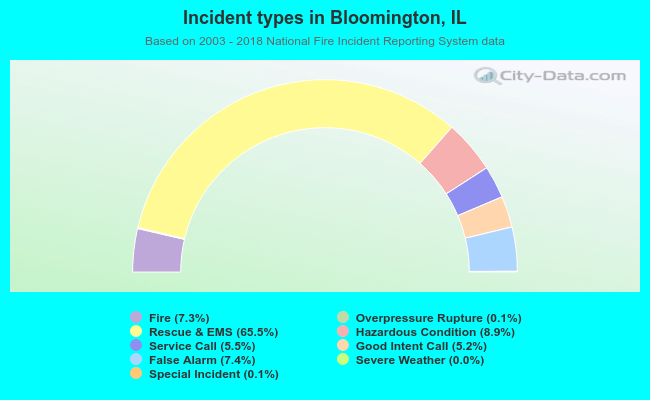 Out of all 51,422 cases reported during the years 2003 - 2018, the most belonged to the categories: Rescue & EMS (65.5%), Hazardous Condition (8.9%), and False Alarm (7.4%).
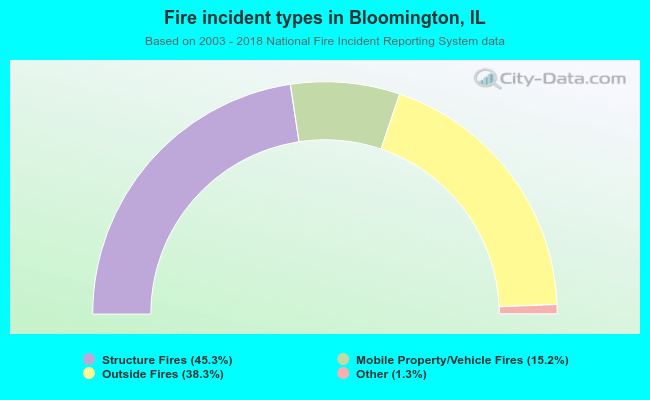 When looking into fire subcategories, the most reports belonged to: Structure Fires (45.3%), and Outside Fires (38.3%).