Niles: Fire Incidents, Illinois (IL)
Where are fire incidents reported in Niles, IL
Something went wrong! Please refresh the page.
| Fire incidents reported | |
|---|---|
| Sreet name | Count |
| MILWAUKEE AV | 326 |
| GOLF RD | 182 |
| MARYLAND AV | 148 |
| TOUHY AV | 146 |
| DEMPSTER ST | 112 |
| MILWAUKEE AV | 98 |
| MILWAUKEE AVE | 56 |
| WAUKEGAN RD | 56 |
| GOLF RD | 54 |
| HOWARD ST | 48 |
| GREENWOOD AV | 46 |
| TOUHY AV | 46 |
| WASHINGTON ST | 46 |
| MARYLAND AV | 42 |
| NORDICA AV | 38 |
| CALDWELL AV | 34 |
| TERRACE DR | 30 |
| TOUHY AVE | 28 |
| GOLF MILL SC | 26 |
| CIVIC CENTER DR | 22 |
| CUMBERLAND AV | 22 |
| DEE RD | 22 |
| LYONS ST | 22 |
| MARYLAND AVE | 22 |
| NEWARK AV | 22 |
| HARLEM AV | 20 |
| NORDICA AVE | 20 |
| OAKTON ST | 20 |
| WISNER ST | 20 |
| DEMPSTER ST | 18 |
2002 - 2018 National Fire Incident Reporting System (NFIRS) incidents
- Incident types reported to NFIRS in Niles, IL
- 25,35862.8%Rescue & EMS
- 4,23710.5%Service Call
- 4,0109.9%False Alarm
- 2,7616.8%Hazardous Condition
- 2,2695.6%Good Intent Call
- 1,5223.8%Fire
- 1000.2%Special Incident
- 720.2%Overpressure Rupture
- Fire incident types reported to NFIRS in Niles, IL
- 82954.5%Structure Fires
- 43228.4%Outside Fires
- 18512.2%Mobile Property/Vehicle Fires
- 765.0%Other
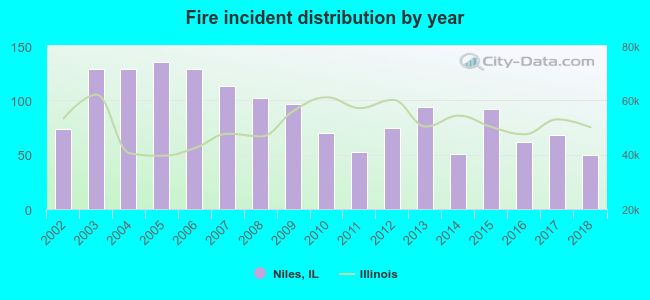 According to the data from the years 2002 - 2018 the average number of fire incidents per year is 90. The highest number of fires - 135 took place in 2005, and the least - 50 in 2018. The data has a declining trend.
The average number of yearly fire incidents per 10k residents in Niles, IL compared to nearest cities:
(Note: Based on data for the last 3 years, including only cities with population 5,000 and above)
| Niles: | 20.0 |
| Morton Grove: | 14.8 |
| Park Ridge: | 14.3 |
| Glenview: | 16.3 |
| Skokie: | 12.6 |
| Des Plaines: | 30.8 |
| Harwood Heights: | 22.5 |
| Lincolnwood: | 16.8 |
| Norridge: | 11.8 |
 The median response time based on all reported fire incidents is 4 minutes. This is lower than the state median value.
The median response time in Niles, IL compared to nearest cities:
(Note: Based on data for all years, including only cities with at least 500 fire incidents)
| Niles: | 4 minutes |
| Morton Grove: | 4 minutes |
| Park Ridge: | 5 minutes |
| Glenview: | 5 minutes |
| Skokie: | 5 minutes |
| Des Plaines: | 5 minutes |
| Lincolnwood: | 4 minutes |
| Wilmette: | 4 minutes |
| Schiller Park: | 4 minutes |
 Based on the data from the years 2002 - 2018 the average number of fire-related casualties per year is 1. The highest number of injuries - 7 took place in 2016, and the lowest - 0 in 2002. The data has a constant trend.
The average number of injuries per 1,000 fires is 13. This indicator was the highest - 113 in 2016, and the lowest 0 in 2002. The trend for injuries per 1,000 incidents is constant. Compared to the Illinois value the number of casualties per 1,000 incidents is similar.
Based on the data from the years 2002 - 2018 the average number of fire-related casualties per year is 1. The highest number of injuries - 7 took place in 2016, and the lowest - 0 in 2002. The data has a constant trend.
The average number of injuries per 1,000 fires is 13. This indicator was the highest - 113 in 2016, and the lowest 0 in 2002. The trend for injuries per 1,000 incidents is constant. Compared to the Illinois value the number of casualties per 1,000 incidents is similar.Casualties per 1,000 incidents in Niles, IL compared to nearest cities:
(Note: Based on data for all years, including only cities with at least 500 fire incidents)
| Niles: | 11.2 |
| Morton Grove: | 3.5 |
| Park Ridge: | 16.8 |
| Glenview: | 17.9 |
| Skokie: | 21.4 |
| Des Plaines: | 37.0 |
| Lincolnwood: | 22.0 |
| Wilmette: | 5.0 |
| Schiller Park: | 8.6 |
 30.7% incidents where reported in the morning and 69.3% in the evening. The most fires (17.6%) took place on Saturday, and the least (11.4%) on Tuesday.
 According to the 1,522 fires from years 2002 - 2018 most fires (10.7%) took place during November, and the least (6.1%) in March.
 Out of all 40,350 cases reported during the years 2002 - 2018, the most belonged to the categories: Rescue & EMS (62.8%), Service Call (10.5%), and False Alarm (9.9%).
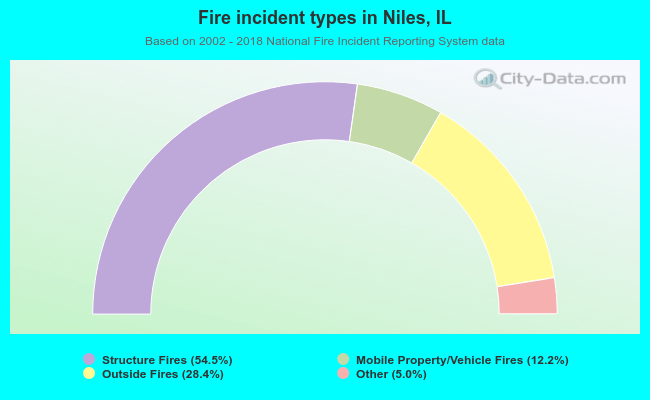 When looking into fire subcategories, the most incidents belonged to: Structure Fires (54.5%), and Outside Fires (28.4%).