Morton Grove: Fire Incidents, Illinois (IL)
Where are fire incidents reported in Morton Grove, IL
Something went wrong! Please refresh the page.
| Fire incidents reported | |
|---|---|
| Sreet name | Count |
| DEMPSTER ST | 190 |
| WAUKEGAN RD | 106 |
| OAKTON ST | 72 |
| GOLF RD | 56 |
| AUSTIN AV | 36 |
| LINCOLN AV | 34 |
| SHERMER RD | 32 |
| LINCOLN AVE | 24 |
| CHURCH ST | 22 |
| DAVIS ST | 22 |
| LEHIGH AV | 22 |
| AUSTIN AVE | 20 |
| LEHIGH AVE | 20 |
| MAPLE ST | 20 |
| PALMA LN | 20 |
| CAPULINA AV | 18 |
| FOSTER ST | 18 |
| ORIOLE AVE | 18 |
| BECKWITH RD | 16 |
| CENTRAL AV | 16 |
| CRAIN ST | 16 |
| MAIN ST | 16 |
| NATIONAL AV | 16 |
| PARKSIDE AV | 16 |
| CALLIE AV | 14 |
| EMERSON ST | 14 |
| HARLEM AV | 14 |
| LYONS ST | 14 |
| ORIOLE AV | 14 |
| SCHOOL ST | 14 |
2002 - 2018 National Fire Incident Reporting System (NFIRS) incidents
- Incident types reported to NFIRS in Morton Grove, IL
- 8,80948.5%Rescue & EMS
- 3,73920.6%Service Call
- 1,7679.7%False Alarm
- 1,4918.2%Hazardous Condition
- 1,4548.0%Good Intent Call
- 8464.7%Fire
- 240.1%Special Incident
- Fire incident types reported to NFIRS in Morton Grove, IL
- 39546.7%Structure Fires
- 30536.1%Outside Fires
- 10412.3%Mobile Property/Vehicle Fires
- 425.0%Other
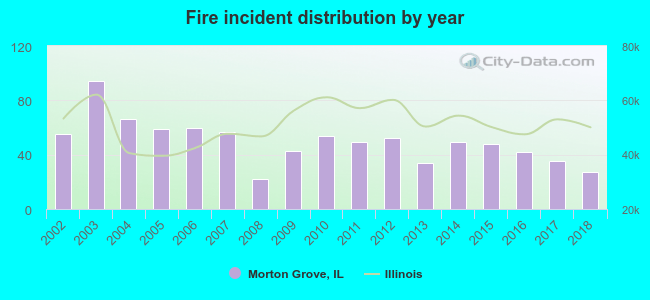 According to the data from the years 2002 - 2018 the average number of fire incidents per year is 50. The highest number of reported fire incidents - 94 took place in 2003, and the least - 22 in 2008. The data has a dropping trend.
The average number of yearly fire incidents per 10k residents in Morton Grove, IL compared to nearest cities:
(Note: Based on data for the last 3 years, including only cities with population 5,000 and above)
| Morton Grove: | 14.8 |
| Niles: | 20.0 |
| Skokie: | 12.6 |
| Glenview: | 16.3 |
| Park Ridge: | 14.3 |
| Lincolnwood: | 16.8 |
| Wilmette: | 19.7 |
| Northfield: | 21.0 |
| Evanston: | 15.6 |
 The median response time based on all reported fire incidents is 4 minutes. This is lower compared to the state median value.
The median response time in Morton Grove, IL compared to nearest cities:
(Note: Based on data for all years, including only cities with at least 500 fire incidents)
| Morton Grove: | 4 minutes |
| Niles: | 4 minutes |
| Skokie: | 5 minutes |
| Glenview: | 5 minutes |
| Park Ridge: | 5 minutes |
| Lincolnwood: | 4 minutes |
| Wilmette: | 4 minutes |
| Evanston: | 4 minutes |
| Winnetka: | 4 minutes |
 According to the data from the years 2002 - 2018 the average number of fire-related casualties per year is 0. The highest number of reported injuries - 1 took place in 2013, and the lowest - 0 in 2002. The data has a constant trend.
The average number of injuries per 1,000 fires is 5. This indicator was the highest - 29 in 2013, and the lowest 0 in 2002. The trend for injuries per 1,000 fire incidents is constant. Compared to the Illinois value the number of injuries per 1,000 incidents is much lower.
According to the data from the years 2002 - 2018 the average number of fire-related casualties per year is 0. The highest number of reported injuries - 1 took place in 2013, and the lowest - 0 in 2002. The data has a constant trend.
The average number of injuries per 1,000 fires is 5. This indicator was the highest - 29 in 2013, and the lowest 0 in 2002. The trend for injuries per 1,000 fire incidents is constant. Compared to the Illinois value the number of injuries per 1,000 incidents is much lower.Casualties per 1,000 incidents in Morton Grove, IL compared to nearest cities:
(Note: Based on data for all years, including only cities with at least 500 fire incidents)
| Morton Grove: | 3.5 |
| Niles: | 11.2 |
| Skokie: | 21.4 |
| Glenview: | 17.9 |
| Park Ridge: | 16.8 |
| Lincolnwood: | 22.0 |
| Wilmette: | 5.0 |
| Evanston: | 23.0 |
| Winnetka: | 15.2 |
 28.8% incidents where reported in the morning and 71.2% in the evening. The most fires (16.8%) took place on Tuesday, and the least (11.3%) on Sunday.
 Based on the 846 reports from years 2002 - 2018 most fires (11.1%) took place during May, and the least (6.1%) in December.
 Out of all 18,155 cases reported during the years 2002 - 2018, the most belonged to the categories: Rescue & EMS (48.5%), Service Call (20.6%), and False Alarm (9.7%).
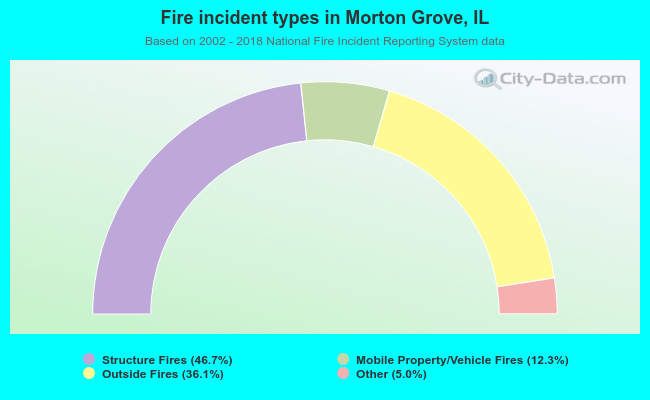 When looking into fire subcategories, the most incidents belonged to: Structure Fires (46.7%), and Outside Fires (36.1%).