Montgomery Village: Fire Incidents, Maryland (MD)
Where are fire incidents reported in Montgomery Village, MD
Something went wrong! Please refresh the page.
|
| |||||||||||||||||||||||||||||||||||||||||||||||||||||||||||||||||||||||||||||||||||||||||||||||||||||||||||||
2004 - 2018 National Fire Incident Reporting System (NFIRS) incidents
- Incident types reported to NFIRS in Montgomery Village, MD
- 7,39673.9%Rescue & EMS
- 9839.8%Good Intent Call
- 5805.8%Service Call
- 3903.9%Hazardous Condition
- 3533.5%False Alarm
- 2882.9%Fire
- 120.1%Overpressure Rupture
- 120.1%Special Incident
- Fire incident types reported to NFIRS in Montgomery Village, MD
- 14349.7%Structure Fires
- 9934.4%Outside Fires
- 3311.5%Mobile Property/Vehicle Fires
- 134.5%Other
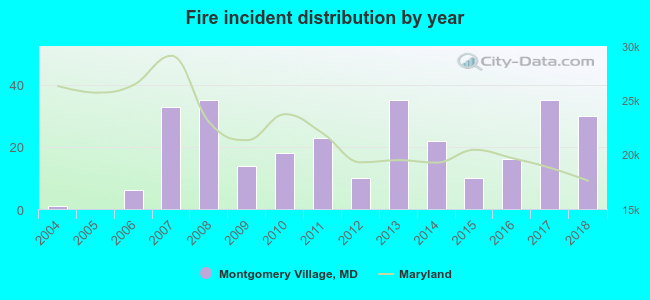 According to the data from the years 2004 - 2018 the average number of fire incidents per year is 19. The highest number of reported fire incidents - 35 took place in 2008, and the least - 0 in 2005. The data has a rising trend.
The average number of yearly fire incidents per 10k residents in Montgomery Village, MD compared to nearest cities:
(Note: Based on data for the last 3 years, including only cities with population 5,000 and above)
| Montgomery Village: | 8.4 |
| Gaithersburg: | 21.4 |
| Germantown: | 10.3 |
| Clarksburg: | 18.6 |
| Olney: | 6.5 |
| Damascus: | 15.7 |
| Rockville: | 18.6 |
| Darnestown: | 20.6 |
| North Bethesda: | 2.2 |

 According to the reports from the years 2004 - 2018 the average number of fire-related yearly casualties is 1. The highest number of reported casualties - 7 took place in 2014, and the lowest - 0 in 2004. The data has a growing trend.
 26.7% incidents where reported in the morning and 73.3% in the evening. The most fires (15.6%) took place on Tuesday, and the least (9.4%) on Thursday.
 Based on the 288 fires from years 2004 - 2018 most fires (14.6%) took place during April, and the least (4.5%) in December.
 Out of all 10,014 cases reported during the years 2004 - 2018, the most belonged to the categories: Rescue & EMS (73.9%), Good Intent Call (9.8%), and Service Call (5.8%).
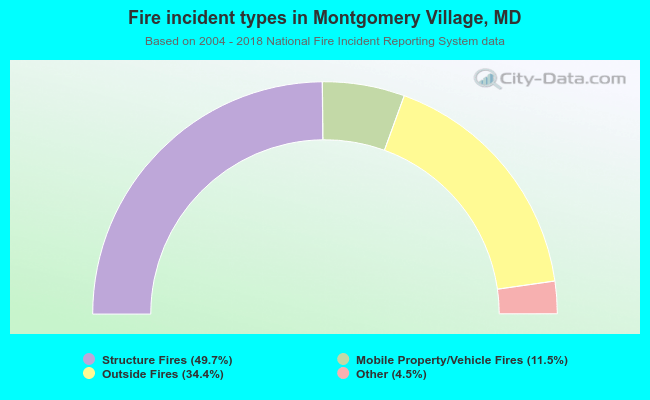 When looking into fire subcategories, the most reports belonged to: Structure Fires (49.7%), and Outside Fires (34.4%).