Germantown: Fire Incidents, Maryland (MD)
Where are fire incidents reported in Germantown, MD
Something went wrong! Please refresh the page.
| Fire incidents reported | |
|---|---|
| Sreet name | Count |
| FREDERICK RD | 100 |
| GERMANTOWN RD | 44 |
| CRYSTAL ROCK DR | 40 |
| MIDDLEBROOK RD | 38 |
| CIRCLE GATE DR | 36 |
| GUNNERS BRANCH RD | 28 |
| MATENY RD | 24 |
| GREAT PARK CIR | 22 |
| WISTERIA DR | 22 |
| CLOPPER RD | 20 |
| RIDGE RD | 20 |
| CINNAMON DR | 18 |
| N270 X13 TO X15 HWY | 18 |
| KENTLANDS BLV | 16 |
| OBSERVATION CT | 16 |
| OBSERVATION DR | 16 |
| SWEETGUM CIR | 16 |
| APPLEDOWRE CIR | 14 |
| BENT WILLOW CIR | 14 |
| N270 X11 TO X13 HWY | 14 |
| DAIRYMAID DR | 12 |
| WALKERS CHOICE RD | 12 |
| WONDERLAND WAY | 12 |
| ARCHDALE RD | 10 |
| CENTURY BLV | 10 |
| CLIMBING IVY DR | 10 |
| CRYSTAL HILL CIR | 10 |
| GREAT SENECA HWY | 10 |
| GREY EAGLE CT | 10 |
| MONTGOMERY VILLAGE AVE | 10 |
| Other | 1,022 |
2004 - 2018 National Fire Incident Reporting System (NFIRS) incidents
- Incident types reported to NFIRS in Germantown, MD
- 20,75065.5%Rescue & EMS
- 3,56411.2%Good Intent Call
- 1,9796.2%Hazardous Condition
- 1,9736.2%Service Call
- 1,6775.3%False Alarm
- 1,6645.3%Fire
- 450.1%Overpressure Rupture
- 330.1%Special Incident
- Fire incident types reported to NFIRS in Germantown, MD
- 69141.5%Outside Fires
- 59435.7%Structure Fires
- 27416.5%Mobile Property/Vehicle Fires
- 1056.3%Other
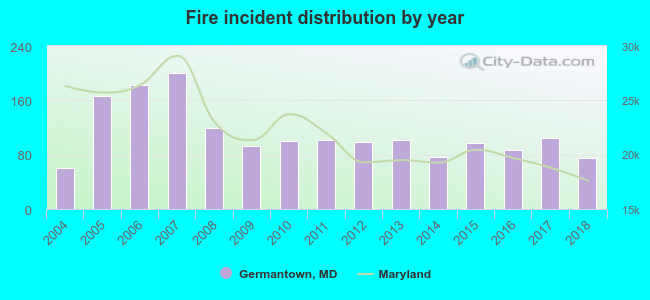 Based on the data from the years 2004 - 2018 the average number of fire incidents per year is 111. The highest number of fire incidents - 200 took place in 2007, and the least - 61 in 2004. The data has an increasing trend.
The average number of yearly fire incidents per 10k residents in Germantown, MD compared to nearest cities:
(Note: Based on data for the last 3 years, including only cities with population 5,000 and above)
| Germantown: | 10.3 |
| Clarksburg: | 18.6 |
| Montgomery Village: | 8.4 |
| Gaithersburg: | 21.4 |
| Darnestown: | 20.6 |
| Damascus: | 15.7 |
| Poolesville: | 20.7 |
| Rockville: | 18.6 |
| Olney: | 6.5 |
 The median response time based on all reported fire incidents is 6 minutes. This is comparable to the Maryland median value.
The median response time in Germantown, MD compared to nearest cities:
(Note: Based on data for all years, including only cities with at least 500 fire incidents)
| Germantown: | 6 minutes |
| Gaithersburg: | 6 minutes |
| Damascus: | 8 minutes |
| Rockville: | 6 minutes |
| Monrovia: | 8 minutes |
| New Market: | 9 minutes |
| Wheaton: | 5 minutes |
| Mount Airy: | 13 minutes |
| Bethesda: | 5 minutes |
 Based on the data from the years 2004 - 2018 the average number of fire-related casualties per year is 2. The highest number of reported casualties - 10 took place in 2014, and the lowest - 0 in 2008. The data has a decreasing trend.
The average number of injuries per 1,000 fires is 26. This indicator was the highest - 132 in 2014, and the lowest 0 in 2008. The trend for injuries per 1,000 incidents is decreasing. Compared to the Maryland value the number of casualties per 1,000 fires is much higher.
Based on the data from the years 2004 - 2018 the average number of fire-related casualties per year is 2. The highest number of reported casualties - 10 took place in 2014, and the lowest - 0 in 2008. The data has a decreasing trend.
The average number of injuries per 1,000 fires is 26. This indicator was the highest - 132 in 2014, and the lowest 0 in 2008. The trend for injuries per 1,000 incidents is decreasing. Compared to the Maryland value the number of casualties per 1,000 fires is much higher.Casualties per 1,000 incidents in Germantown, MD compared to nearest cities:
(Note: Based on data for all years, including only cities with at least 500 fire incidents)
| Germantown: | 22.2 |
| Gaithersburg: | 25.1 |
| Damascus: | 8.6 |
| Rockville: | 15.7 |
| Monrovia: | 3.1 |
| New Market: | 2.4 |
| Wheaton: | 22.9 |
| Mount Airy: | 0.0 |
| Bethesda: | 15.4 |
 28.3% incidents where reported in the morning and 71.7% in the evening. The most fires (16.5%) took place on Saturday, and the least (12.4%) on Thursday.
 According to the 1,664 fires from years 2004 - 2018 most fires (12.1%) took place during March, and the least (6.6%) in September.
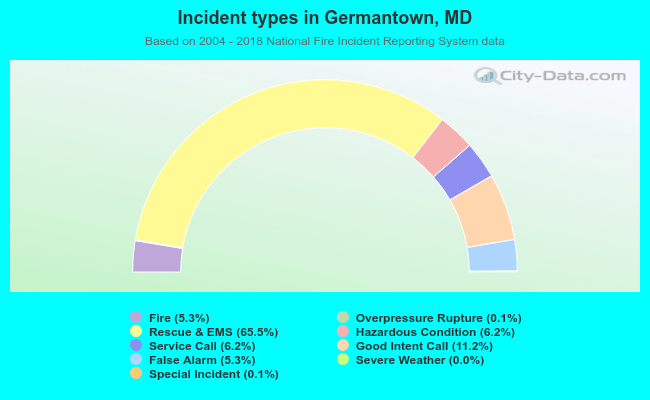 Out of all 31,689 cases reported during the years 2004 - 2018, the most belonged to the categories: Rescue & EMS (65.5%), Good Intent Call (11.2%), and Hazardous Condition (6.2%).
 When looking into fire subcategories, the most reports belonged to: Outside Fires (41.5%), and Structure Fires (35.7%).