Monroeville: Fire Incidents, Alabama (AL)
Where are fire incidents reported in Monroeville, AL
Something went wrong! Please refresh the page.
|
| |||||||||||||||||||||||||||||||||||||||||||||||||||||||||||||||||||||||||||||||||||||||||||||||||||||||||||||
2003 - 2018 National Fire Incident Reporting System (NFIRS) incidents
- Incident types reported to NFIRS in Monroeville, AL
- 36539.5%Hazardous Condition
- 27329.5%Fire
- 13915.0%Rescue & EMS
- 677.2%False Alarm
- 485.2%Good Intent Call
- 303.2%Service Call
- 20.2%Overpressure Rupture
- 10.1%Severe Weather
- Fire incident types reported to NFIRS in Monroeville, AL
- 13649.8%Structure Fires
- 8230.0%Outside Fires
- 4416.1%Mobile Property/Vehicle Fires
- 114.0%Other
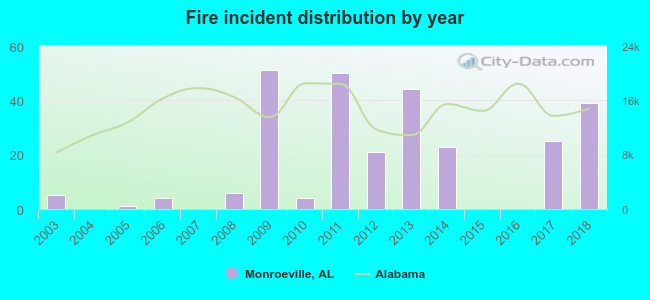 According to the data from the years 2003 - 2018 the average number of fires per year is 17. The highest number of reported fire incidents - 51 took place in 2009, and the least - 0 in 2004. The data has a growing trend.
The average number of yearly fire incidents per 10k residents in Monroeville, AL compared to nearest cities:
(Note: Based on data for the last 3 years, including only cities with population 5,000 and above)
| Monroeville: | 51.7 |
| Brewton: | 95.8 |
| Atmore: | 99.3 |
| Stockton: | 3.9 |
| Greenville: | 81.8 |
| Bay Minette: | 70.7 |
| Andalusia: | 19.1 |

 According to the reports from the years 2003 - 2018 the average number of fire-related casualties per year is 0. The highest number of injuries - 2 took place in 2009, and the lowest - 0 in 2003. The data has a rising trend.
 30.0% incidents where reported in the morning and 70.0% in the evening. The most fires (16.1%) took place on Friday, and the least (10.6%) on Thursday.
 Based on the 273 fires from years 2003 - 2018 most fires (11.7%) took place during March, and the least (5.1%) in May.
 Out of all 925 cases reported during the years 2003 - 2018, the most belonged to the categories: Hazardous Condition (39.5%), Fire (29.5%), and Rescue & EMS (15.0%).
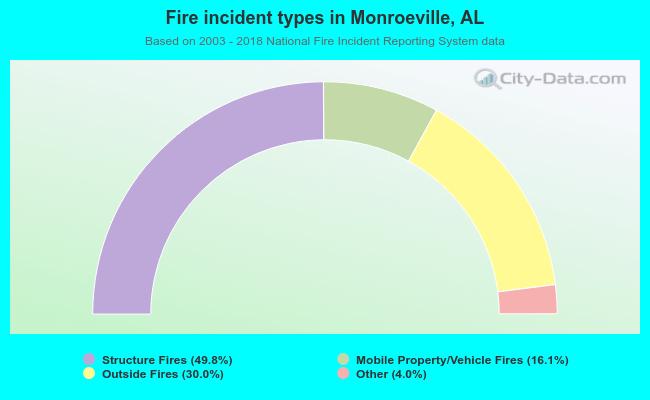 When looking into fire subcategories, the most incidents belonged to: Structure Fires (49.8%), and Outside Fires (30.0%).