Atmore: Fire Incidents, Alabama (AL)
Where are fire incidents reported in Atmore, AL
Something went wrong! Please refresh the page.
|
| |||||||||||||||||||||||||||||||||||||||||||||||||||||||||||||||||||||||||||||||||||||||||||||||||||||||||||||
2002 - 2018 National Fire Incident Reporting System (NFIRS) incidents
- Incident types reported to NFIRS in Atmore, AL
- 2,54740.3%Rescue & EMS
- 1,29320.4%Fire
- 1,21919.3%Hazardous Condition
- 5268.3%False Alarm
- 3285.2%Service Call
- 2443.9%Good Intent Call
- 1242.0%Special Incident
- 360.6%Severe Weather
- Fire incident types reported to NFIRS in Atmore, AL
- 50238.8%Structure Fires
- 42332.7%Outside Fires
- 21116.3%Other
- 15712.1%Mobile Property/Vehicle Fires
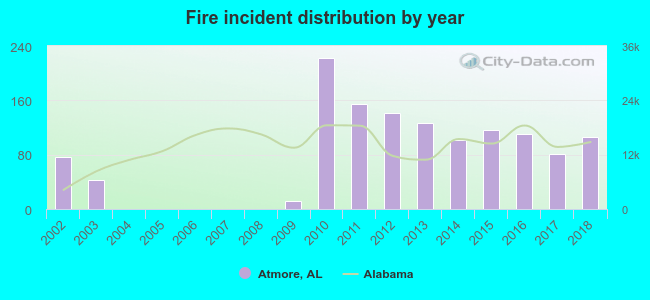 Based on the data from the years 2002 - 2018 the average number of fires per year is 76. The highest number of reported fire incidents - 222 took place in 2010, and the least - 0 in 2004. The data has a growing trend.
The average number of yearly fire incidents per 10k residents in Atmore, AL compared to nearest cities:
(Note: Based on data for the last 3 years, including only cities with population 5,000 and above)
| Atmore: | 99.3 |
| Stockton: | 3.9 |
| Bay Minette: | 70.7 |
| Brewton: | 95.8 |
| Robertsdale: | 38.7 |
| Satsuma: | 58.4 |
| Spanish Fort: | 34.2 |
| Monroeville: | 51.7 |
| Daphne: | 35.3 |
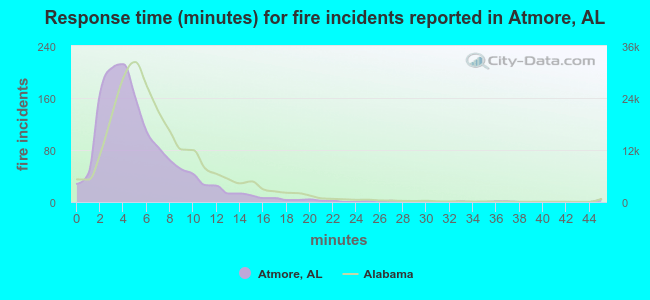 The median response time based on all reported fire incidents is 4 minutes. This is lower compared to the state median value.
The median response time in Atmore, AL compared to nearest cities:
(Note: Based on data for all years, including only cities with at least 500 fire incidents)
| Atmore: | 4 minutes |
| Bay Minette: | 5 minutes |
| Brewton: | 5 minutes |
| Satsuma: | 4 minutes |
| Daphne: | 6 minutes |
| Saraland: | 5 minutes |
| Prichard: | 5 minutes |
| Fairhope: | 8 minutes |
| Evergreen: | 10 minutes |
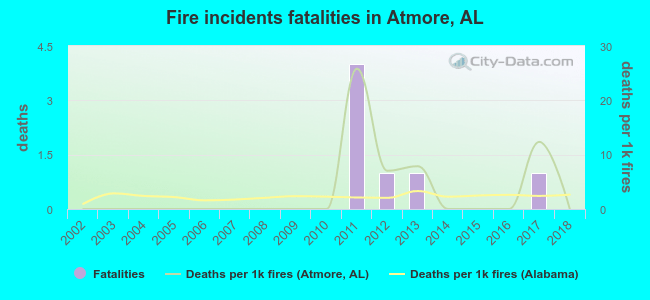 Based on the data from the years 2002 - 2018 the average number of fire-related yearly deaths is 0. The highest number of reported deaths - 4 took place in 2011, and the lowest - 0 in 2002. The data has a constant trend.
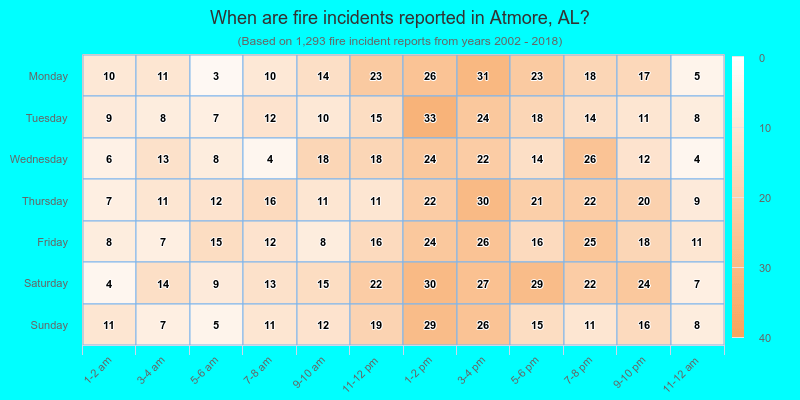
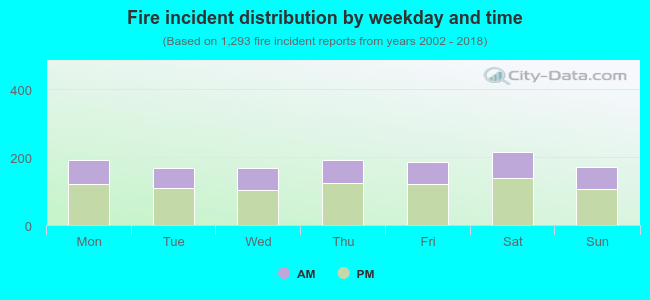 36.7% incidents where reported in the morning and 63.3% in the evening. The most fires (16.7%) took place on Saturday, and the least (13.1%) on Tuesday.
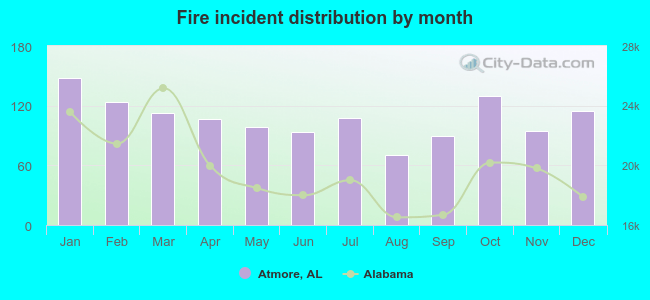 Based on the 1,293 incident reports from years 2002 - 2018 most fires (11.4%) took place during January, and the least (5.4%) in August.
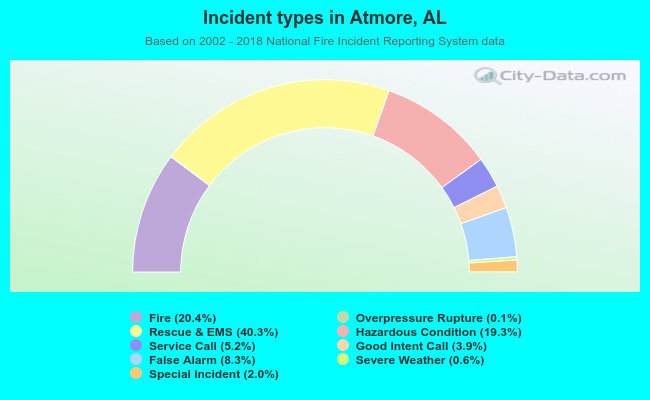 Out of all 6,323 cases reported during the years 2002 - 2018, the most belonged to the categories: Rescue & EMS (40.3%), Fire (20.4%), and Hazardous Condition (19.3%).
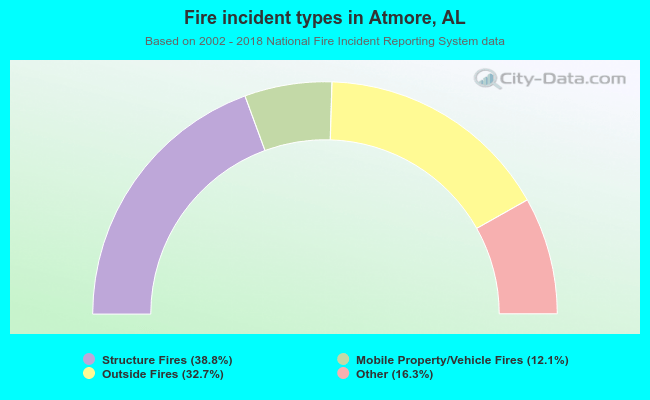 When looking into fire subcategories, the most reports belonged to: Structure Fires (38.8%), and Outside Fires (32.7%).