Monett: Fire Incidents, Missouri (MO)
Where are fire incidents reported in Monett, MO
Something went wrong! Please refresh the page.
|
| |||||||||||||||||||||||||||||||||||||||||||||||||||||||||||||||||||||||||||||||||||||||||||||||||||||||||||||
| Other | 108 | |||||||||||||||||||||||||||||||||||||||||||||||||||||||||||||||||||||||||||||||||||||||||||||||||||||||||||||
2003 - 2018 National Fire Incident Reporting System (NFIRS) incidents
- Incident types reported to NFIRS in Monett, MO
- 1,30240.3%Rescue & EMS
- 69021.3%Fire
- 68721.3%Hazardous Condition
- 2537.8%Service Call
- 2066.4%Good Intent Call
- 812.5%False Alarm
- 90.3%Severe Weather
- Fire incident types reported to NFIRS in Monett, MO
- 36152.3%Outside Fires
- 21330.9%Structure Fires
- 639.1%Mobile Property/Vehicle Fires
- 537.7%Other
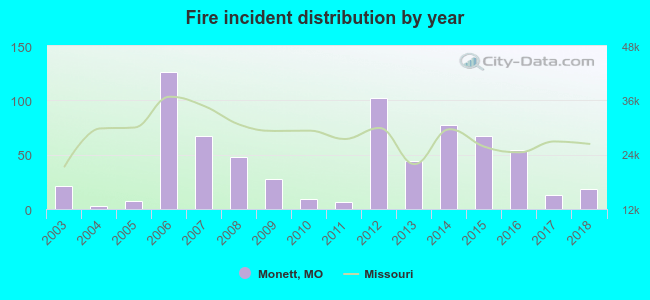 Based on the data from the years 2003 - 2018 the average number of fires per year is 43. The highest number of fires - 126 took place in 2006, and the least - 3 in 2004. The data has a decreasing trend.
The average number of yearly fire incidents per 10k residents in Monett, MO compared to nearest cities:
(Note: Based on data for the last 3 years, including only cities with population 5,000 and above)
| Monett: | 31.7 |
| Aurora: | 23.3 |
| Neosho: | 109.3 |
| Carthage: | 130.1 |
| Republic: | 40.2 |
| Battlefield: | 47.3 |
| Webb City: | 99.0 |
| Joplin: | 74.0 |
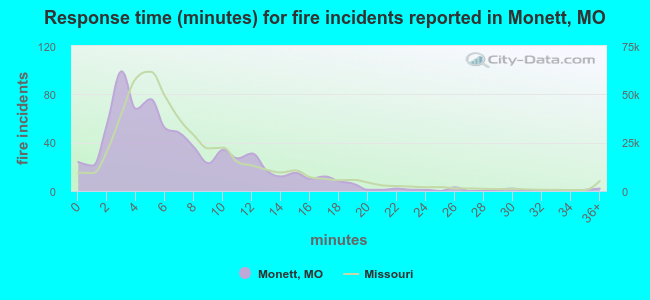 The median response time based on all reported fire incidents is 6 minutes. This is about the same as the state median value.
The median response time in Monett, MO compared to nearest cities:
(Note: Based on data for all years, including only cities with at least 500 fire incidents)
| Monett: | 6 minutes |
| Crane: | 10 minutes |
| Neosho: | 7 minutes |
| Clever: | 11 minutes |
| Galena: | 13 minutes |
| Carthage: | 7 minutes |
| Republic: | 4 minutes |
| Shell Knob: | 7 minutes |
| Reeds Spring: | 10 minutes |
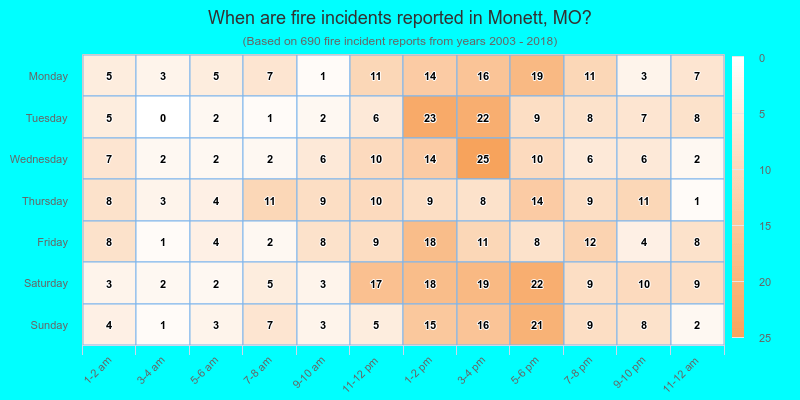
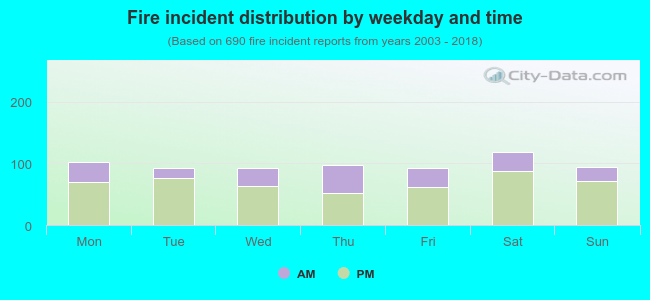 30.3% incidents where reported in the morning and 69.7% in the evening. The most fires (17.2%) took place on Saturday, and the least (13.3%) on Wednesday.
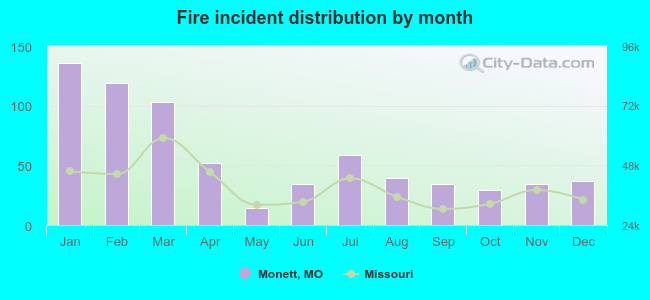 Based on the 690 fire incidents from years 2003 - 2018 most fires (19.7%) took place during January, and the least (2.0%) in May.
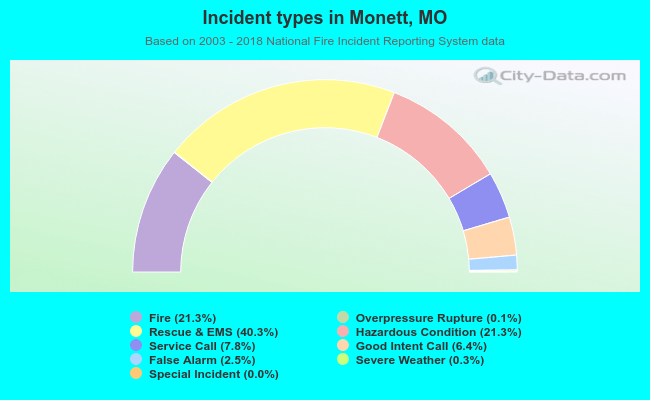 Out of all 3,232 cases reported during the years 2003 - 2018, the most belonged to the categories: Rescue & EMS (40.3%), Fire (21.3%), and Hazardous Condition (21.3%).
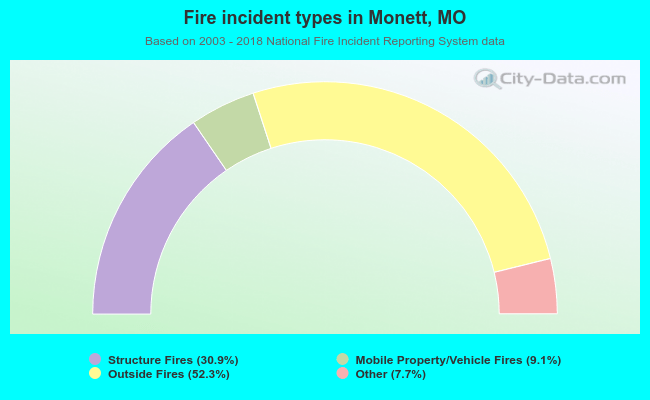 When looking into fire subcategories, the most incidents belonged to: Outside Fires (52.3%), and Structure Fires (30.9%).