Webb City: Fire Incidents, Missouri (MO)
Where are fire incidents reported in Webb City, MO
Something went wrong! Please refresh the page.
| Fire incidents reported | |
|---|---|
| Sreet name | Count |
| MADISON ST | 198 |
| DAUGHERTY ST | 116 |
| HALL ST | 106 |
| BROADWAY ST | 78 |
| MAIN ST | 74 |
| MAIN | 72 |
| TOM ST | 70 |
| ORONOGO ST | 64 |
| AUSTIN ST | 60 |
| ZORA ST | 50 |
| FOUNTAIN RD | 46 |
| BALL ST | 44 |
| 1ST ST | 42 |
| WARE ST | 40 |
| 2ND ST | 34 |
| PENNSYLVANIA ST | 34 |
| ROANE ST | 34 |
| 4TH ST | 32 |
| MACARTHUR DR | 32 |
| NELSON ST | 32 |
| 3RD ST | 30 |
| AYLOR ST | 30 |
| STADIUM DR | 28 |
| WEBB ST | 28 |
| GOLF RD | 26 |
| LIBERTY ST | 26 |
| WALKER ST | 26 |
| 7TH ST | 22 |
| ELLIS ST | 22 |
| JEFFERSON ST | 22 |
2003 - 2018 National Fire Incident Reporting System (NFIRS) incidents
- Incident types reported to NFIRS in Webb City, MO
- 4,81058.2%Rescue & EMS
- 1,42017.2%Fire
- 6858.3%Service Call
- 5336.4%Good Intent Call
- 5036.1%Hazardous Condition
- 3053.7%False Alarm
- 90.1%Special Incident
- Fire incident types reported to NFIRS in Webb City, MO
- 60642.7%Structure Fires
- 59241.7%Outside Fires
- 16211.4%Mobile Property/Vehicle Fires
- 604.2%Other
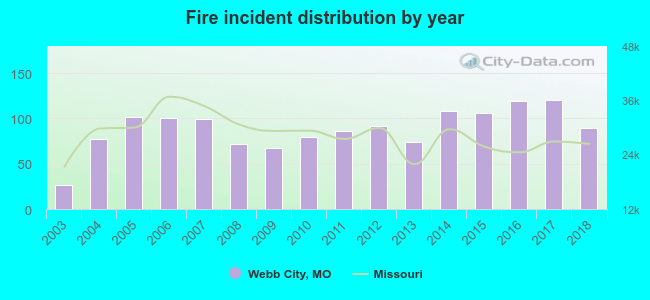 According to the data from the years 2003 - 2018 the average number of fires per year is 89. The highest number of reported fires - 120 took place in 2017, and the least - 27 in 2003. The data has a rising trend.
The average number of yearly fire incidents per 10k residents in Webb City, MO compared to nearest cities:
(Note: Based on data for the last 3 years, including only cities with population 5,000 and above)
| Webb City: | 99.0 |
| Carl Junction: | 5.7 |
| Joplin: | 74.0 |
| Carthage: | 130.1 |
| Neosho: | 109.3 |
 The median response time based on all reported fire incidents is 5 minutes. This is lower than the Missouri median value.
The median response time in Webb City, MO compared to nearest cities:
(Note: Based on data for all years, including only cities with at least 500 fire incidents)
| Webb City: | 5 minutes |
| Joplin: | 6 minutes |
| Carthage: | 7 minutes |
| Galena: | 5 minutes |
| Baxter Springs: | 7 minutes |
| Columbus: | 10 minutes |
| Neosho: | 7 minutes |
| Pittsburg: | 3 minutes |
| Seneca: | 9 minutes |
 According to the data from the years 2003 - 2018 the average number of fire-related casualties per year is 1. The highest number of injuries - 3 took place in 2004, and the lowest - 0 in 2003. The data has a constant trend.
The average number of casualties per 1,000 fires is 7. This indicator was the highest - 39 in 2004, and the lowest 0 in 2003. The trend for injuries per 1,000 incidents is constant. Compared to the Missouri value the number of injuries per 1,000 incidents is similar.
According to the data from the years 2003 - 2018 the average number of fire-related casualties per year is 1. The highest number of injuries - 3 took place in 2004, and the lowest - 0 in 2003. The data has a constant trend.
The average number of casualties per 1,000 fires is 7. This indicator was the highest - 39 in 2004, and the lowest 0 in 2003. The trend for injuries per 1,000 incidents is constant. Compared to the Missouri value the number of injuries per 1,000 incidents is similar.
 32.0% incidents where reported in the morning and 68.0% in the evening. The most fires (15.5%) took place on Tuesday, and the least (12.5%) on Monday.
 According to the 1,420 fires from years 2003 - 2018 most fires (11.5%) took place during July, and the least (6.2%) in May.
 Out of all 8,271 cases reported during the years 2003 - 2018, the most belonged to the categories: Rescue & EMS (58.2%), Fire (17.2%), and Service Call (8.3%).
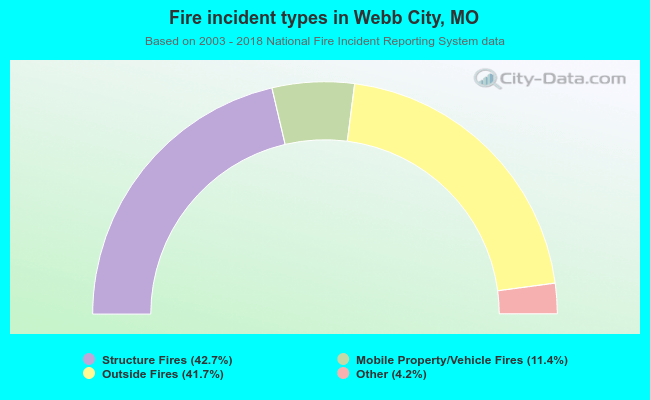 When looking into fire subcategories, the most incidents belonged to: Structure Fires (42.7%), and Outside Fires (41.7%).