Lowell: Fire Incidents, Arkansas (AR)
Where are fire incidents reported in Lowell, AR
Something went wrong! Please refresh the page.
|
| |||||||||||||||||||||||||||||||||||||||||||||||||||||||||||||||||||||||||||||||||||||||||||||||||||||||||||||
2002 - 2018 National Fire Incident Reporting System (NFIRS) incidents
- Incident types reported to NFIRS in Lowell, AR
- 3,46451.2%Rescue & EMS
- 1,57523.3%Fire
- 5508.1%Good Intent Call
- 4286.3%Hazardous Condition
- 3805.6%False Alarm
- 3435.1%Service Call
- 100.1%Overpressure Rupture
- 90.1%Severe Weather
- 70.1%Special Incident
- Fire incident types reported to NFIRS in Lowell, AR
- 84253.5%Outside Fires
- 53333.8%Structure Fires
- 18311.6%Mobile Property/Vehicle Fires
- 171.1%Other
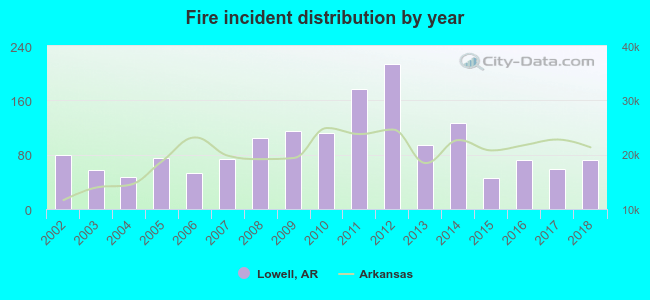 According to the data from the years 2002 - 2018 the average number of fires per year is 93. The highest number of reported fire incidents - 214 took place in 2012, and the least - 45 in 2015. The data has a dropping trend.
The average number of yearly fire incidents per 10k residents in Lowell, AR compared to nearest cities:
(Note: Based on data for the last 3 years, including only cities with population 5,000 and above)
| Lowell: | 81.2 |
| Rogers: | 34.1 |
| Springdale: | 34.6 |
| Bentonville: | 36.0 |
| Centerton: | 41.7 |
| Fayetteville: | 40.9 |
| Pea Ridge: | 27.4 |
| Bella Vista: | 30.7 |
| Farmington: | 87.0 |
 The median response time based on all reported fire incidents is 5 minutes. This is lower compared to the state median value.
The median response time in Lowell, AR compared to nearest cities:
(Note: Based on data for all years, including only cities with at least 500 fire incidents)
| Lowell: | 5 minutes |
| Rogers: | 6 minutes |
| Springdale: | 5 minutes |
| Bentonville: | 5 minutes |
| Centerton: | 6 minutes |
| Fayetteville: | 5 minutes |
| Pea Ridge: | 9 minutes |
| Bella Vista: | 6 minutes |
| Garfield: | 12 minutes |
 29.3% incidents where reported in the morning and 70.7% in the evening. The most fires (16.1%) took place on Saturday, and the least (12.9%) on Tuesday.
 According to the 1,575 fire incident reports from years 2002 - 2018 most fires (13.5%) took place during January, and the least (5.3%) in June.
 Out of all 6,766 cases reported during the years 2002 - 2018, the most belonged to the categories: Rescue & EMS (51.2%), Fire (23.3%), and Good Intent Call (8.1%).
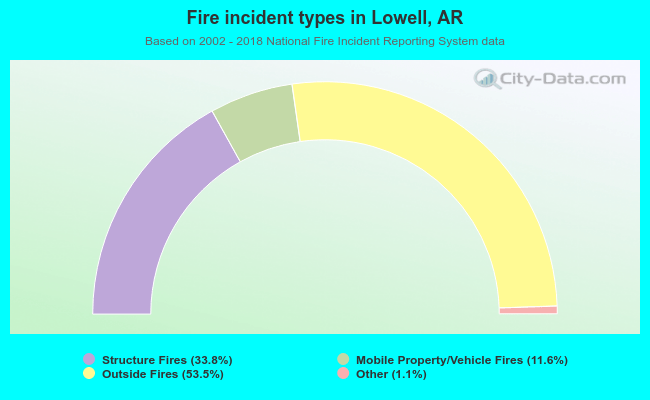 When looking into fire subcategories, the most incidents belonged to: Outside Fires (53.5%), and Structure Fires (33.8%).