Bentonville: Fire Incidents, Arkansas (AR)
Where are fire incidents reported in Bentonville, AR
Something went wrong! Please refresh the page.
| Fire incidents reported | |
|---|---|
| Sreet name | Count |
| WALTON BLVD | 256 |
| A ST | 102 |
| 14TH ST | 92 |
| REGIONAL AIRPORT BLVD | 72 |
| 14TH | 70 |
| CENTRAL AVE | 68 |
| J ST | 64 |
| MOBERLY LN | 56 |
| I 540 | 52 |
| HWY 72 | 50 |
| I49 | 44 |
| MOBERLY LANE | 40 |
| PLENTYWOOD RD | 40 |
| D ST | 38 |
| 2ND | 36 |
| PHYLLIS ST | 36 |
| 10TH ST | 34 |
| 2ND ST | 34 |
| E ST | 34 |
| 8TH ST | 32 |
| MCNELLY RD | 32 |
| C ST | 30 |
| 3RD ST | 28 |
| PUNKIN HOLLOW RD | 28 |
| 3RD | 26 |
| BELLA VISTA RD | 26 |
| MAIN ST | 26 |
| S ST | 26 |
| 10TH | 24 |
| AR 72 HWY | 24 |
| Other | 654 |
2002 - 2018 National Fire Incident Reporting System (NFIRS) incidents
- Incident types reported to NFIRS in Bentonville, AR
- 17,78666.7%Rescue & EMS
- 2,3188.7%False Alarm
- 2,1748.2%Fire
- 1,7866.7%Hazardous Condition
- 1,2534.7%Service Call
- 1,2144.6%Good Intent Call
- 760.3%Special Incident
- 330.1%Severe Weather
- 320.1%Overpressure Rupture
- Fire incident types reported to NFIRS in Bentonville, AR
- 1,07049.2%Outside Fires
- 71532.9%Structure Fires
- 35516.3%Mobile Property/Vehicle Fires
- 341.6%Other
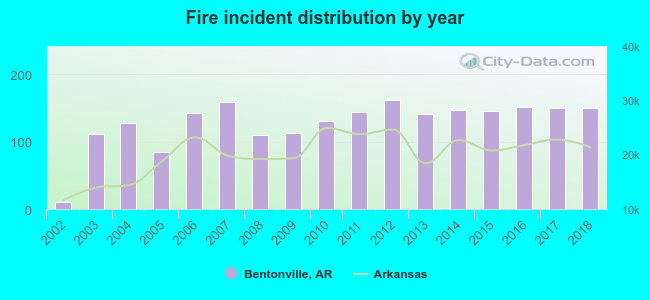 According to the data from the years 2002 - 2018 the average number of fire incidents per year is 128. The highest number of reported fires - 161 took place in 2012, and the least - 11 in 2002. The data has a growing trend.
The average number of yearly fire incidents per 10k residents in Bentonville, AR compared to nearest cities:
(Note: Based on data for the last 3 years, including only cities with population 5,000 and above)
| Bentonville: | 36.0 |
| Centerton: | 41.7 |
| Rogers: | 34.1 |
| Bella Vista: | 30.7 |
| Pea Ridge: | 27.4 |
| Lowell: | 81.2 |
| Springdale: | 34.6 |
| Fayetteville: | 40.9 |
| Siloam Springs: | 56.9 |
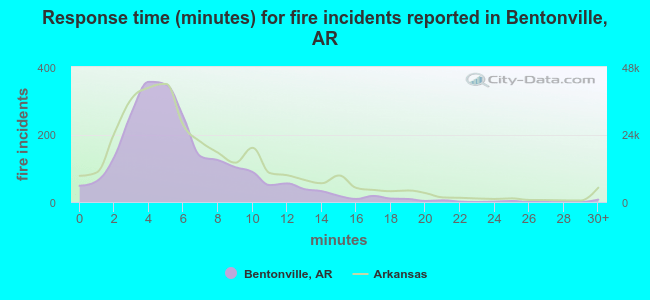 The median response time based on all reported fire incidents is 5 minutes. This is lower than the Arkansas median value.
The median response time in Bentonville, AR compared to nearest cities:
(Note: Based on data for all years, including only cities with at least 500 fire incidents)
| Bentonville: | 5 minutes |
| Centerton: | 6 minutes |
| Rogers: | 6 minutes |
| Bella Vista: | 6 minutes |
| Pea Ridge: | 9 minutes |
| Lowell: | 5 minutes |
| Springdale: | 5 minutes |
| Garfield: | 12 minutes |
| Gentry: | 8 minutes |
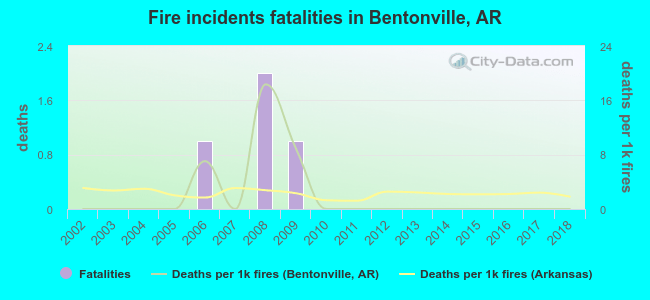 According to the data from the years 2002 - 2018 the average number of fire-related yearly deaths is 0. The highest number of reported deaths - 2 took place in 2008, and the lowest - 0 in 2002. The data has a constant trend.
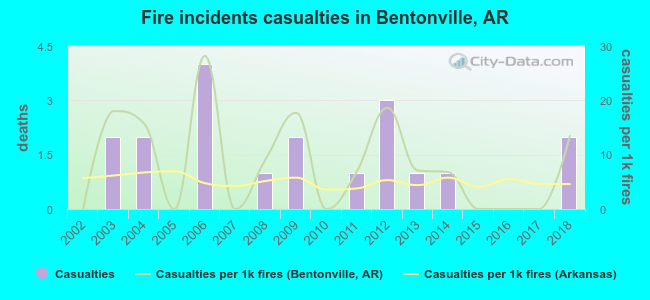 According to the reports from the years 2002 - 2018 the average number of fire-related casualties per year is 1. The highest number of casualties - 4 took place in 2006, and the lowest - 0 in 2002. The data has a growing trend.
The average number of casualties per 1,000 fires is 8. This indicator was the highest - 28 in 2006, and the lowest 0 in 2002. The trend for casualties per 1,000 fire incidents is growing. Compared to the Arkansas value the number of injuries per 1,000 fire incidents is higher.
According to the reports from the years 2002 - 2018 the average number of fire-related casualties per year is 1. The highest number of casualties - 4 took place in 2006, and the lowest - 0 in 2002. The data has a growing trend.
The average number of casualties per 1,000 fires is 8. This indicator was the highest - 28 in 2006, and the lowest 0 in 2002. The trend for casualties per 1,000 fire incidents is growing. Compared to the Arkansas value the number of injuries per 1,000 fire incidents is higher.Casualties per 1,000 incidents in Bentonville, AR compared to nearest cities:
(Note: Based on data for all years, including only cities with at least 500 fire incidents)
| Bentonville: | 8.7 |
| Centerton: | 0.0 |
| Rogers: | 9.7 |
| Bella Vista: | 3.7 |
| Pea Ridge: | 4.0 |
| Lowell: | 1.3 |
| Springdale: | 17.8 |
| Garfield: | 3.5 |
| Gentry: | 3.6 |
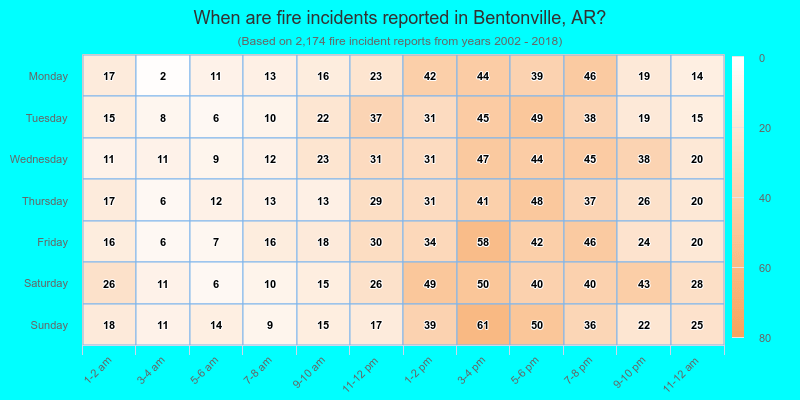
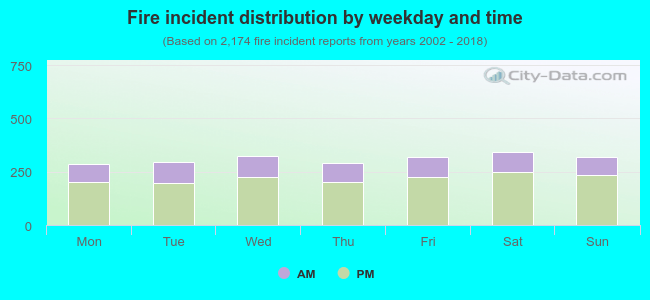 29.3% incidents where reported in the morning and 70.7% in the evening. The most fires (15.8%) took place on Saturday, and the least (13.2%) on Monday.
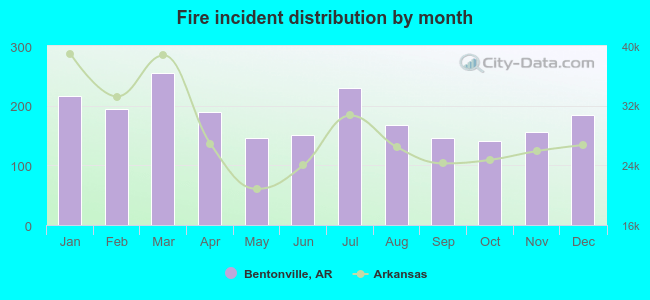 According to the 2,174 fires from years 2002 - 2018 most fires (11.7%) took place during March, and the least (6.4%) in October.
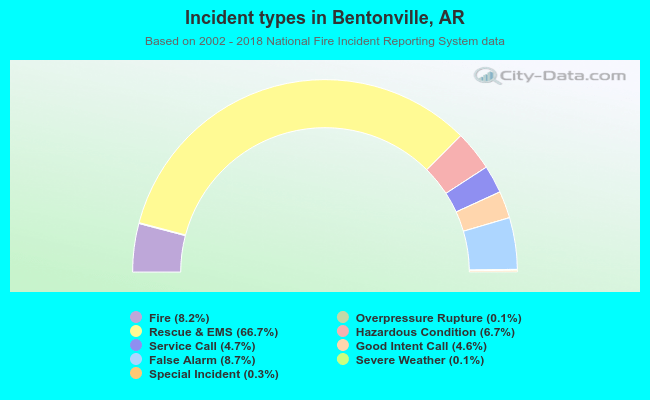 Out of all 26,672 cases reported during the years 2002 - 2018, the most belonged to the categories: Rescue & EMS (66.7%), False Alarm (8.7%), and Fire (8.2%).
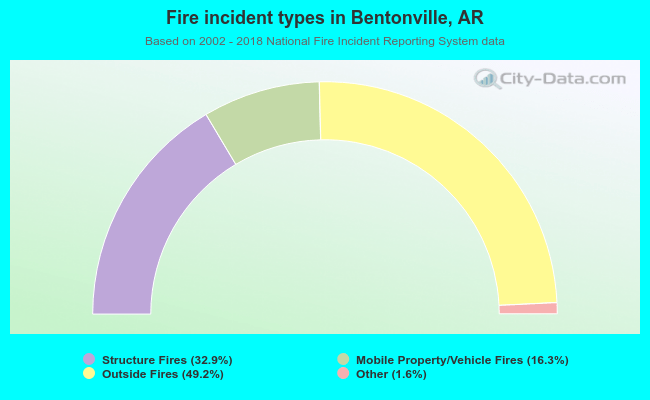 When looking into fire subcategories, the most incidents belonged to: Outside Fires (49.2%), and Structure Fires (32.9%).