Loveland: Fire Incidents, Colorado (CO)
Where are fire incidents reported in Loveland, CO
Something went wrong! Please refresh the page.
| Fire incidents reported | |
|---|---|
| Sreet name | Count |
| EISENHOWER BLVD | 170 |
| GARFIELD AVE | 170 |
| LINCOLN AVE | 140 |
| INTERSTATE 25 NB | 106 |
| TAFT AVE | 100 |
| 1ST ST | 82 |
| 29TH ST | 82 |
| HIGHWAY 34 | 80 |
| INTERSTATE 25 SB | 80 |
| 4TH ST | 78 |
| 57TH ST | 68 |
| MONROE AVE | 68 |
| 5TH ST | 64 |
| EAGLE DR | 56 |
| WILSON AVE | 56 |
| 10TH ST | 54 |
| 8TH ST | 50 |
| 2ND ST | 48 |
| 7TH ST | 48 |
| BUTTERNUT DR | 46 |
| 14TH ST | 44 |
| 23RD ST | 42 |
| GLADE RD | 42 |
| 16TH ST | 38 |
| ROCKY MOUNTAIN AVE | 36 |
| BOYD LAKE AVE | 34 |
| CLEVELAND AVE | 34 |
| COUNTY ROAD 29 | 34 |
| DENVER AVE | 34 |
| MADISON AVE | 34 |
| Other | 746 |
2003 - 2018 National Fire Incident Reporting System (NFIRS) incidents
- Incident types reported to NFIRS in Loveland, CO
- 21,64350.0%Rescue & EMS
- 7,12716.5%Hazardous Condition
- 4,85311.2%Good Intent Call
- 3,5338.2%False Alarm
- 3,2657.5%Service Call
- 2,7646.4%Fire
- Fire incident types reported to NFIRS in Loveland, CO
- 1,18742.9%Outside Fires
- 98935.8%Structure Fires
- 43015.6%Mobile Property/Vehicle Fires
- 1585.7%Other
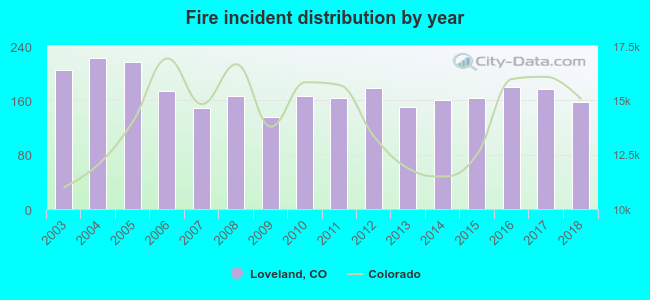 According to the data from the years 2003 - 2018 the average number of fire incidents per year is 173. The highest number of fire incidents - 222 took place in 2004, and the least - 136 in 2009. The data has a decreasing trend.
The average number of yearly fire incidents per 10k residents in Loveland, CO compared to nearest cities:
(Note: Based on data for the last 3 years, including only cities with population 5,000 and above)
| Loveland: | 23.6 |
| Berthoud: | 96.4 |
| Johnstown: | 33.8 |
| Windsor: | 20.8 |
| Fort Collins: | 18.5 |
| Milliken: | 36.7 |
| Longmont: | 28.6 |
| Greeley: | 21.7 |
| Evans: | 35.8 |
 The median response time based on all reported fire incidents is 6 minutes. This is comparable to the Colorado median value.
The median response time in Loveland, CO compared to nearest cities:
(Note: Based on data for all years, including only cities with at least 500 fire incidents)
| Loveland: | 6 minutes |
| Berthoud: | 9 minutes |
| Johnstown: | 9 minutes |
| Windsor: | 7 minutes |
| Fort Collins: | 6 minutes |
| Longmont: | 7 minutes |
| Greeley: | 7 minutes |
| Platteville: | 9 minutes |
| Evans: | 6 minutes |
 Based on the data from the years 2003 - 2018 the average number of fire-related yearly deaths is 1. The highest number of reported deaths - 2 took place in 2004, and the lowest - 0 in 2003. The data has a constant trend.
The average number of fatalities per 1,000 fire incidents is 3. This indicator was the highest - 12 in 2014, and the lowest 0 in 2003. The trend for fatalities per 1,000 incidents is constant. Compared to the Colorado value the number of fatalities per 1,000 fires is higher.
Based on the data from the years 2003 - 2018 the average number of fire-related yearly deaths is 1. The highest number of reported deaths - 2 took place in 2004, and the lowest - 0 in 2003. The data has a constant trend.
The average number of fatalities per 1,000 fire incidents is 3. This indicator was the highest - 12 in 2014, and the lowest 0 in 2003. The trend for fatalities per 1,000 incidents is constant. Compared to the Colorado value the number of fatalities per 1,000 fires is higher.Deaths per 1,000 incidents in Loveland, CO compared to nearest cities:
(Note: Based on data for all years, including only cities with at least 2,500 fire incidents)
| Loveland: | 2.9 |
| Fort Collins: | 1.0 |
| Longmont: | 0.9 |
| Greeley: | 2.0 |
| Boulder: | 1.7 |
| Thornton: | 1.4 |
| Westminster: | 4.5 |
 Based on the reports from the years 2003 - 2018 the average number of fire-related casualties per year is 2. The highest number of reported casualties - 5 took place in 2005, and the lowest - 0 in 2004. The data has a constant trend.
The average number of injuries per 1,000 fires is 14. This indicator was the highest - 29 in 2009, and the lowest 0 in 2004. The trend for injuries per 1,000 fire incidents is rising. Compared to the state value the number of casualties per 1,000 incidents is about the same.
Based on the reports from the years 2003 - 2018 the average number of fire-related casualties per year is 2. The highest number of reported casualties - 5 took place in 2005, and the lowest - 0 in 2004. The data has a constant trend.
The average number of injuries per 1,000 fires is 14. This indicator was the highest - 29 in 2009, and the lowest 0 in 2004. The trend for injuries per 1,000 fire incidents is rising. Compared to the state value the number of casualties per 1,000 incidents is about the same.Casualties per 1,000 incidents in Loveland, CO compared to nearest cities:
(Note: Based on data for all years, including only cities with at least 500 fire incidents)
| Loveland: | 13.7 |
| Berthoud: | 2.3 |
| Johnstown: | 1.6 |
| Windsor: | 1.3 |
| Fort Collins: | 25.2 |
| Longmont: | 6.0 |
| Greeley: | 11.3 |
| Platteville: | 0.0 |
| Evans: | 5.9 |
 29.2% incidents where reported in the morning and 70.8% in the evening. The most fires (15.5%) took place on Saturday, and the least (13.0%) on Thursday.
 According to the 2,764 fire incident reports from years 2003 - 2018 most fires (13.7%) took place during July, and the least (5.8%) in January.
 Out of all 43,286 cases reported during the years 2003 - 2018, the most belonged to the categories: Rescue & EMS (50.0%), Hazardous Condition (16.5%), and Good Intent Call (11.2%).
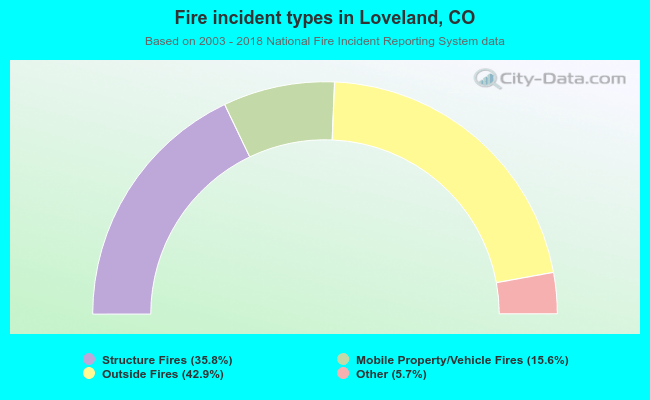 When looking into fire subcategories, the most incidents belonged to: Outside Fires (42.9%), and Structure Fires (35.8%).