Fort Collins: Fire Incidents, Colorado (CO)
Where are fire incidents reported in Fort Collins, CO
Something went wrong! Please refresh the page.
| Fire incidents reported | |
|---|---|
| Sreet name | Count |
| COLLEGE AVE | 502 |
| PROSPECT RD | 208 |
| TAFT HILL RD | 206 |
| HARMONY RD | 192 |
| MULBERRY ST | 188 |
| SHIELDS ST | 184 |
| LEMAY AVE | 174 |
| TIMBERLINE RD | 168 |
| PLUM ST | 156 |
| ELIZABETH ST | 134 |
| DRAKE RD | 124 |
| LAUREL ST | 114 |
| LAPORTE AVE | 108 |
| HORSETOOTH RD | 96 |
| STUART ST | 96 |
| I25NB | 74 |
| MASON ST | 70 |
| MOUNTAIN AVE | 68 |
| FRONTAGE RD | 66 |
| VINE DR | 66 |
| CENTER AVE | 64 |
| STANFORD RD | 64 |
| I25 | 62 |
| BOARDWALK DR | 60 |
| LAKE ST | 58 |
| LINDEN ST | 54 |
| OAK ST | 54 |
| STOVER ST | 54 |
| SHERWOOD ST | 52 |
| SWALLOW RD | 52 |
| Other | 1,438 |
2002 - 2018 National Fire Incident Reporting System (NFIRS) incidents
- Incident types reported to NFIRS in Fort Collins, CO
- 55,63562.0%Rescue & EMS
- 12,58714.0%Good Intent Call
- 5,9096.6%False Alarm
- 5,1875.8%Hazardous Condition
- 5,1135.7%Service Call
- 5,0065.6%Fire
- 1730.2%Special Incident
- Fire incident types reported to NFIRS in Fort Collins, CO
- 2,16043.1%Outside Fires
- 1,87737.5%Structure Fires
- 74114.8%Mobile Property/Vehicle Fires
- 2284.6%Other
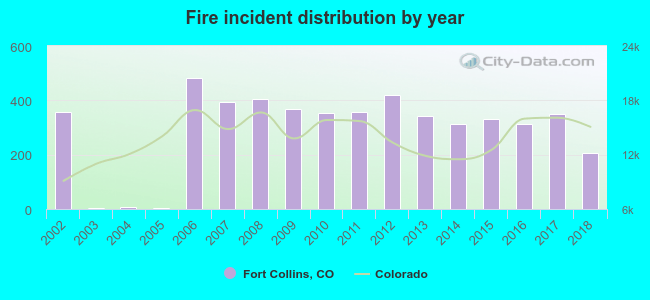 Based on the data from the years 2002 - 2018 the average number of fires per year is 294. The highest number of reported fire incidents - 484 took place in 2006, and the least - 2 in 2003. The data has a dropping trend.
The average number of yearly fire incidents per 10k residents in Fort Collins, CO compared to nearest cities:
(Note: Based on data for the last 3 years, including only cities with population 5,000 and above)
| Fort Collins: | 18.5 |
| Windsor: | 20.8 |
| Wellington: | 64.0 |
| Loveland: | 23.6 |
| Berthoud: | 96.4 |
| Johnstown: | 33.8 |
| Milliken: | 36.7 |
| Greeley: | 21.7 |
| Evans: | 35.8 |
 The median response time based on all reported fire incidents is 6 minutes. This is about the same as the state median value.
The median response time in Fort Collins, CO compared to nearest cities:
(Note: Based on data for all years, including only cities with at least 500 fire incidents)
| Fort Collins: | 6 minutes |
| Windsor: | 7 minutes |
| Wellington: | 11 minutes |
| Loveland: | 6 minutes |
| Berthoud: | 9 minutes |
| Johnstown: | 9 minutes |
| Eaton: | 8 minutes |
| Greeley: | 7 minutes |
| Evans: | 6 minutes |
 Based on the reports from the years 2002 - 2018 the average number of fire-related yearly deaths is 0. The highest number of reported deaths - 3 took place in 2017, and the lowest - 0 in 2002. The data has a constant trend.
The average number of deaths per 1,000 fire incidents is 1. This indicator was the highest - 9 in 2017, and the lowest 0 in 2002. The trend for fatalities per 1,000 fire incidents is constant. Compared to the state value the number of deaths per 1,000 fires is lower.
Based on the reports from the years 2002 - 2018 the average number of fire-related yearly deaths is 0. The highest number of reported deaths - 3 took place in 2017, and the lowest - 0 in 2002. The data has a constant trend.
The average number of deaths per 1,000 fire incidents is 1. This indicator was the highest - 9 in 2017, and the lowest 0 in 2002. The trend for fatalities per 1,000 fire incidents is constant. Compared to the state value the number of deaths per 1,000 fires is lower.
 According to the reports from the years 2002 - 2018 the average number of fire-related yearly casualties is 7. The highest number of reported casualties - 23 took place in 2010, and the lowest - 0 in 2003. The data has a dropping trend.
The average number of casualties per 1,000 fire incidents is 21. This indicator was the highest - 65 in 2010, and the lowest 0 in 2003. The trend for injuries per 1,000 fires is dropping. Compared to the Colorado value the number of casualties per 1,000 fire incidents is higher.
According to the reports from the years 2002 - 2018 the average number of fire-related yearly casualties is 7. The highest number of reported casualties - 23 took place in 2010, and the lowest - 0 in 2003. The data has a dropping trend.
The average number of casualties per 1,000 fire incidents is 21. This indicator was the highest - 65 in 2010, and the lowest 0 in 2003. The trend for injuries per 1,000 fires is dropping. Compared to the Colorado value the number of casualties per 1,000 fire incidents is higher.
 31.3% incidents where reported in the morning and 68.7% in the evening. The most fires (15.6%) took place on Saturday, and the least (12.9%) on Monday.
 According to the 5,006 reports from years 2002 - 2018 most fires (11.1%) took place during June, and the least (6.2%) in January.
 Out of all 89,692 cases reported during the years 2002 - 2018, the most belonged to the categories: Rescue & EMS (62.0%), Good Intent Call (14.0%), and False Alarm (6.6%).
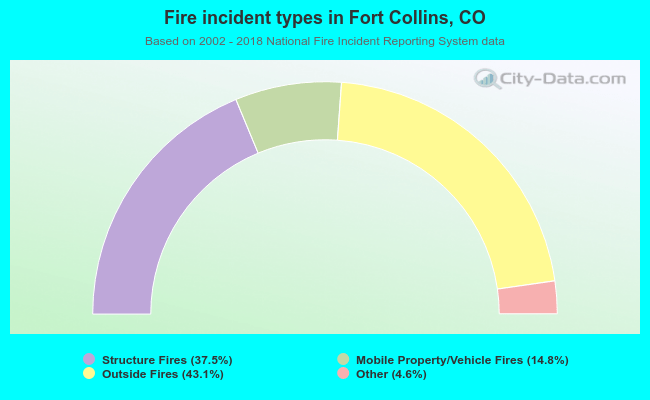 When looking into fire subcategories, the most incidents belonged to: Outside Fires (43.1%), and Structure Fires (37.5%).