Lakewood: Fire Incidents, New Jersey (NJ)
Where are fire incidents reported in Lakewood, NJ
Something went wrong! Please refresh the page.
| Fire incidents reported | |
|---|---|
| Sreet name | Count |
| OCEAN AVE | 72 |
| RIVER AVE | 68 |
| SEVENTH ST | 38 |
| RT. 70 | 36 |
| CLIFTON AVE | 34 |
| FOREST AVE | 32 |
| FIFTH ST | 30 |
| CROSS ST | 28 |
| CEDAR BRIDGE AVE | 26 |
| MADISON AVE | 26 |
| NEW HAMPSHIRE AVE | 26 |
| FOURTH ST | 24 |
| MASSACHUSETTS AVE | 24 |
| RIDGE AVE | 24 |
| LEXINGTON AVE | 20 |
| PARK AVE | 20 |
| AIRPORT RD | 18 |
| COUNTY LINE RD | 16 |
| KENNEDY BLVD | 16 |
| PRINCETON AVE | 16 |
| SIXTH ST | 16 |
| EIGHTH ST | 14 |
| FARADAY AVE | 14 |
| CLOVER ST | 12 |
| LAKE DR | 12 |
| LAWRENCE AVE | 12 |
| MONMOUTH AVE | 12 |
| PROSPECT ST | 12 |
| SECOND ST | 12 |
| AMERICA AVE | 10 |
| Other | 114 |
2005 - 2018 National Fire Incident Reporting System (NFIRS) incidents
- Incident types reported to NFIRS in Lakewood, NJ
- 1,06653.0%Hazardous Condition
- 83441.5%Fire
- 763.8%Service Call
- 311.5%Good Intent Call
- 30.1%Rescue & EMS
- Fire incident types reported to NFIRS in Lakewood, NJ
- 48458.0%Structure Fires
- 21625.9%Outside Fires
- 12915.5%Mobile Property/Vehicle Fires
- 50.6%Other
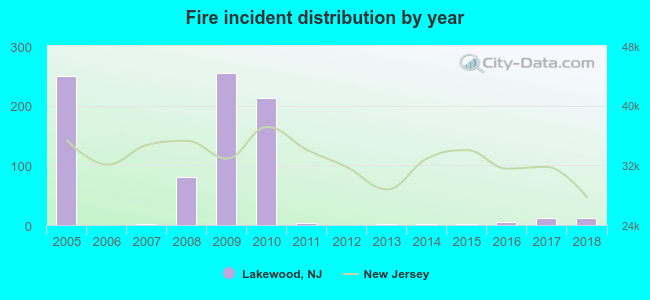 Based on the data from the years 2005 - 2018 the average number of fire incidents per year is 60. The highest number of fires - 254 took place in 2009, and the least - 0 in 2006. The data has a dropping trend.
The average number of yearly fire incidents per 10k residents in Lakewood, NJ compared to nearest cities:
(Note: Based on data for the last 3 years, including only cities with population 5,000 and above)
| Lakewood: | 1.7 |
| Point Pleasant: | 5.9 |
| Toms River: | 21.6 |
| Manasquan: | 64.2 |
| Beachwood: | 36.7 |
| Belmar: | 23.9 |
| Freehold: | 84.1 |
| Asbury Park: | 53.2 |
| Tinton Falls: | 47.9 |
 The median response time based on all reported fire incidents is 4 minutes. This is lower compared to the state median value.
The median response time in Lakewood, NJ compared to nearest cities:
(Note: Based on data for all years, including only cities with at least 500 fire incidents)
| Lakewood: | 4 minutes |
| Toms River: | 6 minutes |
| Manasquan: | 5 minutes |
| Beachwood: | 4 minutes |
| Freehold: | 5 minutes |
| Asbury Park: | 3 minutes |
| Tinton Falls: | 7 minutes |
| Oakhurst: | 5 minutes |
| Eatontown: | 5 minutes |
 According to the data from the years 2005 - 2018 the average number of fire-related fatalities per year is 0. The highest number of deaths - 3 took place in 2009, and the lowest - 0 in 2005. The data has a constant trend.
 According to the data from the years 2005 - 2018 the average number of fire-related casualties per year is 3. The highest number of reported injuries - 20 took place in 2005, and the lowest - 0 in 2006. The data has a declining trend.
The average number of injuries per 1,000 fires is 12. This indicator was the highest - 80 in 2005, and the lowest 0 in 2006. The trend for injuries per 1,000 fires is declining. Compared to the state value the number of injuries per 1,000 incidents is much higher.
According to the data from the years 2005 - 2018 the average number of fire-related casualties per year is 3. The highest number of reported injuries - 20 took place in 2005, and the lowest - 0 in 2006. The data has a declining trend.
The average number of injuries per 1,000 fires is 12. This indicator was the highest - 80 in 2005, and the lowest 0 in 2006. The trend for injuries per 1,000 fires is declining. Compared to the state value the number of injuries per 1,000 incidents is much higher.Casualties per 1,000 incidents in Lakewood, NJ compared to nearest cities:
(Note: Based on data for all years, including only cities with at least 500 fire incidents)
| Lakewood: | 44.4 |
| Toms River: | 10.0 |
| Manasquan: | 7.1 |
| Beachwood: | 10.2 |
| Freehold: | 3.1 |
| Asbury Park: | 11.6 |
| Tinton Falls: | 5.5 |
| Oakhurst: | 5.8 |
| Eatontown: | 26.9 |
 29.3% incidents where reported in the morning and 70.7% in the evening. The most fires (17.1%) took place on Thursday, and the least (10.3%) on Saturday.
 Based on the 834 fire incidents from years 2005 - 2018 most fires (11.5%) took place during March, and the least (6.5%) in October.
 Out of all 2,011 cases reported during the years 2005 - 2018, the most belonged to the categories: Rescue & EMS (53.0%), Fire (41.5%), and Hazardous Condition (3.8%).
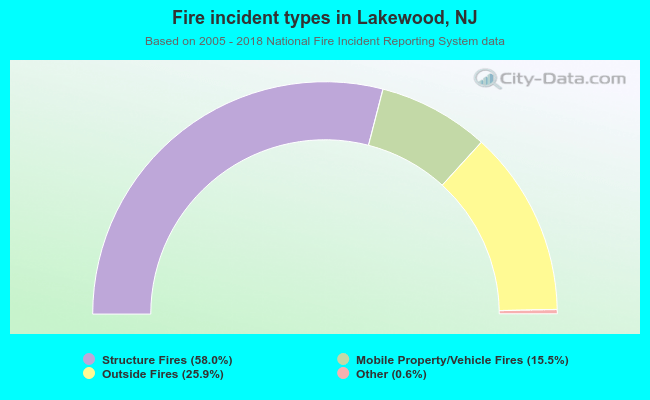 When looking into fire subcategories, the most incidents belonged to: Structure Fires (58.0%), and Outside Fires (25.9%).