Asbury Park: Fire Incidents, New Jersey (NJ)
Where are fire incidents reported in Asbury Park, NJ
Something went wrong! Please refresh the page.
| Fire incidents reported | |
|---|---|
| Sreet name | Count |
| BOSTON WAY | 370 |
| THIRD AVE | 360 |
| FIRST AVE | 340 |
| SECOND AVE | 144 |
| OCEAN AVE | 140 |
| ASBURY AVE | 120 |
| COMSTOCK ST | 120 |
| FOURTH AVE | 120 |
| SEWALL AVE | 116 |
| MAIN ST | 114 |
| BANGS AVE | 102 |
| FIFTH AVE | 102 |
| GRAND AVE | 102 |
| LANGFORD ST | 102 |
| 3RD AVE | 90 |
| DEAL LAKE DR | 90 |
| MEMORIAL DR | 86 |
| ATKINS AVE | 80 |
| SUMMERFIELD AVE | 72 |
| SPRINGWOOD AVE | 70 |
| MONROE AVE | 68 |
| SIXTH AVE | 64 |
| SUNSET AVE | 60 |
| BOSTON WAY | 56 |
| EIGHTH AVE | 54 |
| COOKMAN AVE | 52 |
| SEVENTH AVE | 48 |
| WASHINGTON AVE | 48 |
| RIDGE AVE | 46 |
| 1ST AVE | 44 |
2004 - 2018 National Fire Incident Reporting System (NFIRS) incidents
- Incident types reported to NFIRS in Asbury Park, NJ
- 15,27959.6%Rescue & EMS
- 3,20212.5%False Alarm
- 2,3619.2%Hazardous Condition
- 2,1508.4%Fire
- 1,9277.5%Service Call
- 6602.6%Good Intent Call
- 280.1%Special Incident
- Fire incident types reported to NFIRS in Asbury Park, NJ
- 1,60074.4%Structure Fires
- 33915.8%Outside Fires
- 1205.6%Mobile Property/Vehicle Fires
- 914.2%Other
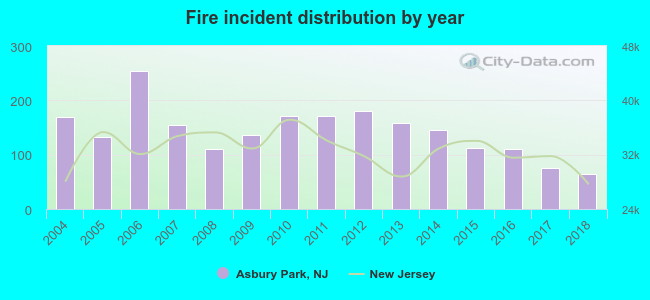 Based on the data from the years 2004 - 2018 the average number of fires per year is 143. The highest number of fires - 254 took place in 2006, and the least - 65 in 2018. The data has a decreasing trend.
The average number of yearly fire incidents per 10k residents in Asbury Park, NJ compared to nearest cities:
(Note: Based on data for the last 3 years, including only cities with population 5,000 and above)
| Asbury Park: | 53.2 |
| Belmar: | 23.9 |
| West Long Branch: | 4.2 |
| Long Branch: | 29.6 |
| Eatontown: | 35.6 |
| Tinton Falls: | 47.9 |
| Oceanport: | 26.3 |
| Manasquan: | 64.2 |
| Little Silver: | 11.3 |
 The median response time based on all reported fire incidents is 3 minutes. This is lower than the state median value.
The median response time in Asbury Park, NJ compared to nearest cities:
(Note: Based on data for all years, including only cities with at least 500 fire incidents)
| Asbury Park: | 3 minutes |
| Oakhurst: | 5 minutes |
| West Long Branch: | 4 minutes |
| Long Branch: | 3 minutes |
| Eatontown: | 5 minutes |
| Tinton Falls: | 7 minutes |
| Manasquan: | 5 minutes |
| Lakewood: | 4 minutes |
| Freehold: | 5 minutes |
 According to the reports from the years 2004 - 2018 the average number of fire-related casualties per year is 2. The highest number of reported injuries - 6 took place in 2017, and the lowest - 0 in 2007. The data has a rising trend.
The average number of injuries per 1,000 fire incidents is 16. This indicator was the highest - 79 in 2017, and the lowest 0 in 2007. The trend for casualties per 1,000 incidents is growing. Compared to the New Jersey value the number of injuries per 1,000 fire incidents is higher.
According to the reports from the years 2004 - 2018 the average number of fire-related casualties per year is 2. The highest number of reported injuries - 6 took place in 2017, and the lowest - 0 in 2007. The data has a rising trend.
The average number of injuries per 1,000 fire incidents is 16. This indicator was the highest - 79 in 2017, and the lowest 0 in 2007. The trend for casualties per 1,000 incidents is growing. Compared to the New Jersey value the number of injuries per 1,000 fire incidents is higher.Casualties per 1,000 incidents in Asbury Park, NJ compared to nearest cities:
(Note: Based on data for all years, including only cities with at least 500 fire incidents)
| Asbury Park: | 11.6 |
| Oakhurst: | 5.8 |
| West Long Branch: | 0.0 |
| Long Branch: | 7.6 |
| Eatontown: | 26.9 |
| Tinton Falls: | 5.5 |
| Manasquan: | 7.1 |
| Lakewood: | 44.4 |
| Freehold: | 3.1 |
 34.0% incidents where reported in the morning and 66.0% in the evening. The most fires (16.2%) took place on Saturday, and the least (13.2%) on Friday.
 Based on the 2,150 reports from years 2004 - 2018 most fires (10.2%) took place during July, and the least (6.4%) in August.
 Out of all 25,617 cases reported during the years 2004 - 2018, the most belonged to the categories: Rescue & EMS (59.6%), False Alarm (12.5%), and Hazardous Condition (9.2%).
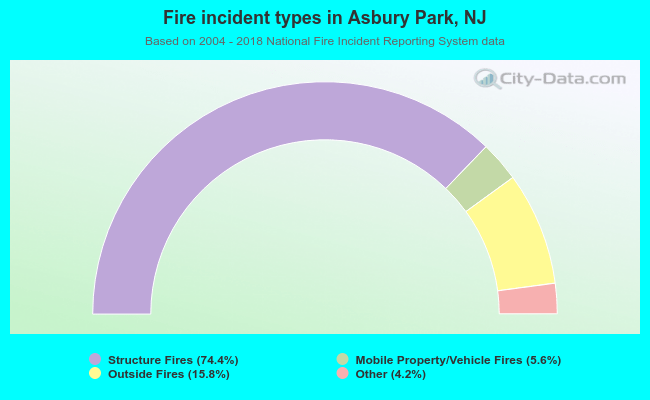 When looking into fire subcategories, the most reports belonged to: Structure Fires (74.4%), and Outside Fires (15.8%).