King City: Fire Incidents, California (CA)
Where are fire incidents reported in King City, CA
Something went wrong! Please refresh the page.
|
| |||||||||||||||||||||||||||||||||||||||||||||||||||||||||||||||||||||||||||||||||||||||||||||||||||||||||||||
2005 - 2018 National Fire Incident Reporting System (NFIRS) incidents
- Incident types reported to NFIRS in King City, CA
- 15733.0%Fire
- 10722.5%Good Intent Call
- 10321.6%Rescue & EMS
- 6112.8%Hazardous Condition
- 296.1%Service Call
- 173.6%False Alarm
- 20.4%Special Incident
- Fire incident types reported to NFIRS in King City, CA
- 11170.7%Outside Fires
- 2616.6%Mobile Property/Vehicle Fires
- 1610.2%Structure Fires
- 42.5%Other
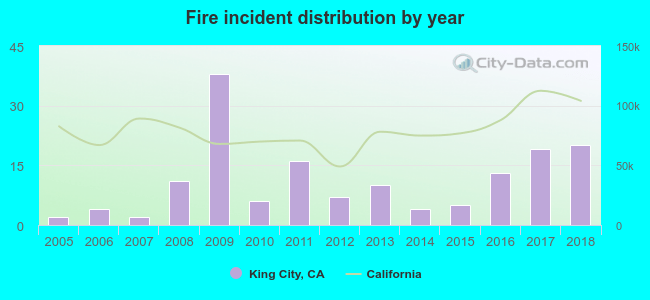 According to the data from the years 2005 - 2018 the average number of fires per year is 11. The highest number of fire incidents - 38 took place in 2009, and the least - 2 in 2005. The data has an increasing trend.
The average number of yearly fire incidents per 10k residents in King City, CA compared to nearest cities:
(Note: Based on data for the last 3 years, including only cities with population 5,000 and above)
| King City: | 12.8 |
| Greenfield: | 50.4 |
| Soledad: | 11.7 |
| Gonzales: | 3.6 |
| Carmel Valley: | 19.7 |
| Coalinga: | 82.7 |
| Salinas: | 20.1 |
| Cambria: | 33.2 |
| Hollister: | 26.9 |

 31.8% incidents where reported in the morning and 68.2% in the evening. The most fires (17.8%) took place on Tuesday, and the least (11.5%) on Friday.
 Based on the 157 incident reports from years 2005 - 2018 most fires (17.2%) took place during June, and the least (1.3%) in December.
 Out of all 476 cases reported during the years 2005 - 2018, the most belonged to the categories: Fire (33.0%), Service Call (22.5%), and Overpressure Rupture (21.6%).
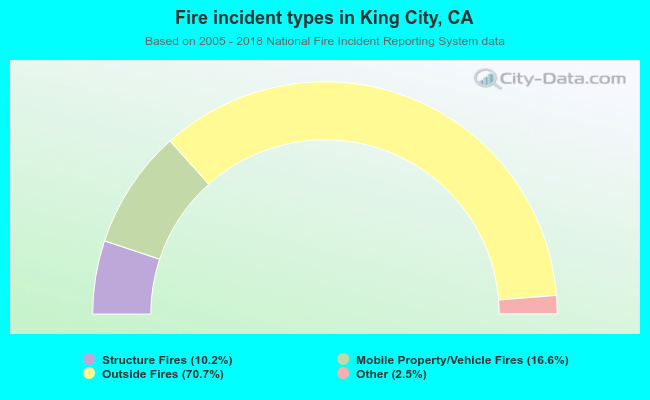 When looking into fire subcategories, the most reports belonged to: Outside Fires (70.7%), and Mobile Property/Vehicle Fires (16.6%).