Cambria: Fire Incidents, California (CA)
Where are fire incidents reported in Cambria, CA
Something went wrong! Please refresh the page.
|
| |||||||||||||||||||||||||||||||||||||||||||||||||||||||||||||||||||||||||||||||||||||||||||||||||||||||||||||
2005 - 2018 National Fire Incident Reporting System (NFIRS) incidents
- Incident types reported to NFIRS in Cambria, CA
- 2,25256.6%Rescue & EMS
- 68617.2%Service Call
- 46411.7%Good Intent Call
- 2185.5%False Alarm
- 2005.0%Hazardous Condition
- 1373.4%Fire
- 200.5%Severe Weather
- Fire incident types reported to NFIRS in Cambria, CA
- 9770.8%Outside Fires
- 2719.7%Structure Fires
- 85.8%Other
- 53.6%Mobile Property/Vehicle Fires
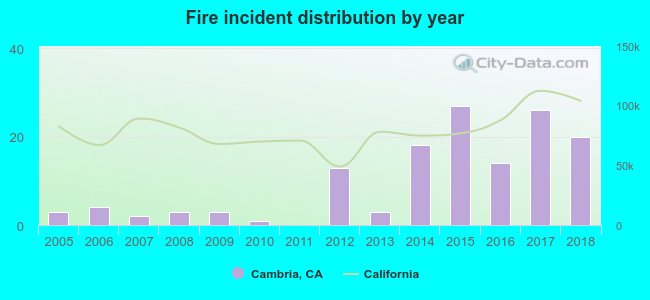 Based on the data from the years 2005 - 2018 the average number of fire incidents per year is 10. The highest number of reported fire incidents - 27 took place in 2015, and the least - 0 in 2011. The data has a rising trend.
The average number of yearly fire incidents per 10k residents in Cambria, CA compared to nearest cities:
(Note: Based on data for the last 3 years, including only cities with population 5,000 and above)
| Cambria: | 33.2 |
| Morro Bay: | 3.8 |
| Templeton: | 44.7 |
| Los Osos: | 0.7 |
| Atascadero: | 15.8 |
| Paso Robles: | 29.8 |
| San Luis Obispo: | 13.2 |
| Pismo Beach: | 9.2 |
| Grover Beach: | 0.7 |

 37.2% incidents where reported in the morning and 62.8% in the evening. The most fires (19.7%) took place on Tuesday, and the least (9.5%) on Wednesday.
 Based on the 137 fire incidents from years 2005 - 2018 most fires (20.4%) took place during July, and the least (2.9%) in March.
 Out of all 3,980 cases reported during the years 2005 - 2018, the most belonged to the categories: Overpressure Rupture (56.6%), Hazardous Condition (17.2%), and Service Call (11.7%).
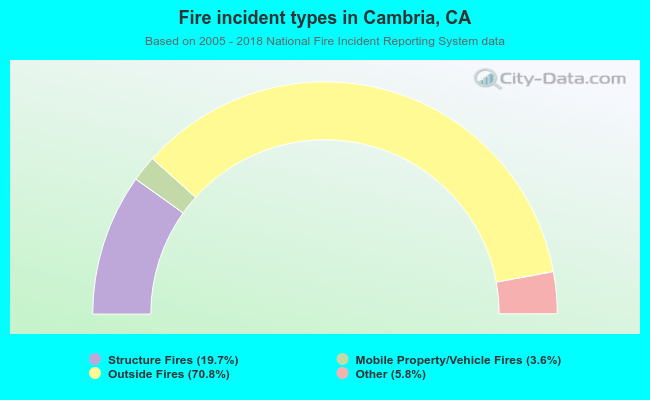 When looking into fire subcategories, the most reports belonged to: Outside Fires (70.8%), and Structure Fires (19.7%).