Jennings: Fire Incidents, Missouri (MO)
Where are fire incidents reported in Jennings, MO
Something went wrong! Please refresh the page.
| Fire incidents reported | |
|---|---|
| Sreet name | Count |
| SWITZER AVE | 98 |
| SWITZER | 96 |
| HAMILTON | 80 |
| HODIAMONT | 74 |
| HALLS FERRY RD | 70 |
| WEST FLORISSANT AVE | 68 |
| HELEN | 64 |
| JENNINGS STATION RD | 64 |
| HAMILTON AVE | 58 |
| LUCAS HUNT RD | 58 |
| MAYA LN | 54 |
| JANET | 52 |
| JANET AVE | 46 |
| LUCAS HUNT | 44 |
| JENNINGS RD | 42 |
| MCLARAN | 42 |
| WILBORN | 42 |
| FLETCHER | 40 |
| FLORISSANT | 38 |
| TYRELL | 38 |
| W. FLORISSANT AV | 38 |
| HALLS FERRY | 36 |
| HAMILTON AV | 36 |
| HODIAMONT AVE | 36 |
| JENNINGS | 36 |
| WILBORN AV | 36 |
| EMMA | 28 |
| BOYCE PL | 26 |
| HALLSFERRY | 26 |
| LORDAN | 26 |
| Other | 753 |
2002 - 2018 National Fire Incident Reporting System (NFIRS) incidents
- Incident types reported to NFIRS in Jennings, MO
- 2,24526.4%Fire
- 1,96323.1%Hazardous Condition
- 1,93022.7%Rescue & EMS
- 98511.6%False Alarm
- 8269.7%Good Intent Call
- 4875.7%Service Call
- 610.7%Special Incident
- Fire incident types reported to NFIRS in Jennings, MO
- 1,18552.8%Structure Fires
- 53423.8%Outside Fires
- 29613.2%Mobile Property/Vehicle Fires
- 23010.2%Other
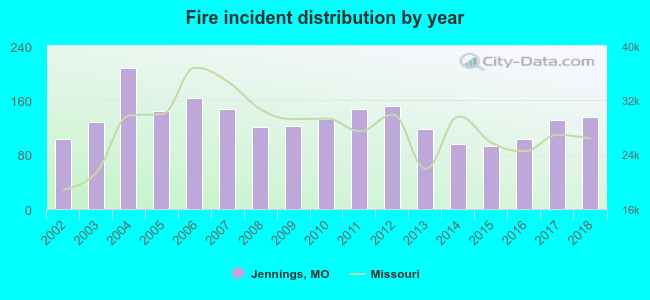 Based on the data from the years 2002 - 2018 the average number of fires per year is 132. The highest number of fire incidents - 208 took place in 2004, and the least - 93 in 2015. The data has a growing trend.
The average number of yearly fire incidents per 10k residents in Jennings, MO compared to nearest cities:
(Note: Based on data for the last 3 years, including only cities with population 5,000 and above)
| Jennings: | 83.5 |
| Ferguson: | 75.6 |
| Dellwood: | 51.9 |
| Glasgow Village: | 7.4 |
| Berkeley: | 76.3 |
| Black Jack: | 7.2 |
| Spanish Lake: | 8.7 |
| University City: | 47.4 |
| Overland: | 19.6 |
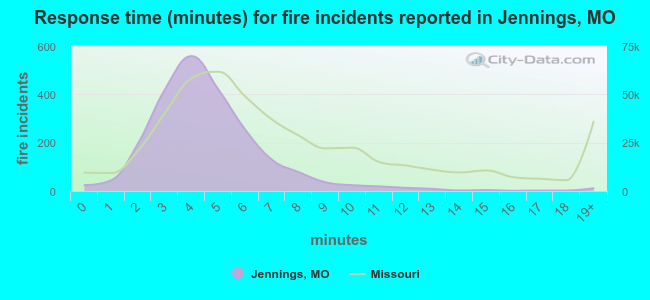 The median response time based on all reported fire incidents is 4 minutes. This is lower than the Missouri median value.
The median response time in Jennings, MO compared to nearest cities:
(Note: Based on data for all years, including only cities with at least 500 fire incidents)
| Jennings: | 4 minutes |
| Normandy: | 6 minutes |
| Ferguson: | 4 minutes |
| Riverview: | 5 minutes |
| Berkeley: | 4 minutes |
| Spanish Lake: | 7 minutes |
| University City: | 5 minutes |
| Overland: | 5 minutes |
| Florissant: | 5 minutes |
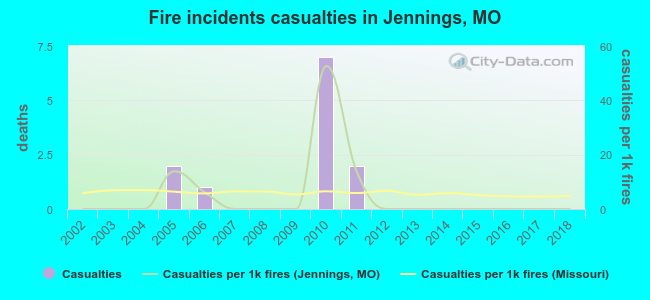 Based on the data from the years 2002 - 2018 the average number of fire-related yearly casualties is 1. The highest number of reported injuries - 7 took place in 2010, and the lowest - 0 in 2002. The data has a constant trend.
The average number of casualties per 1,000 fires is 5. This indicator was the highest - 53 in 2010, and the lowest 0 in 2002. The trend for casualties per 1,000 incidents is constant. Compared to the Missouri value the number of injuries per 1,000 fire incidents is about the same.
Based on the data from the years 2002 - 2018 the average number of fire-related yearly casualties is 1. The highest number of reported injuries - 7 took place in 2010, and the lowest - 0 in 2002. The data has a constant trend.
The average number of casualties per 1,000 fires is 5. This indicator was the highest - 53 in 2010, and the lowest 0 in 2002. The trend for casualties per 1,000 incidents is constant. Compared to the Missouri value the number of injuries per 1,000 fire incidents is about the same.Casualties per 1,000 incidents in Jennings, MO compared to nearest cities:
(Note: Based on data for all years, including only cities with at least 500 fire incidents)
| Jennings: | 5.3 |
| Normandy: | 0.0 |
| Ferguson: | 9.9 |
| Riverview: | 0.0 |
| Berkeley: | 12.4 |
| Spanish Lake: | 0.0 |
| University City: | 5.5 |
| Overland: | 3.6 |
| Florissant: | 7.1 |
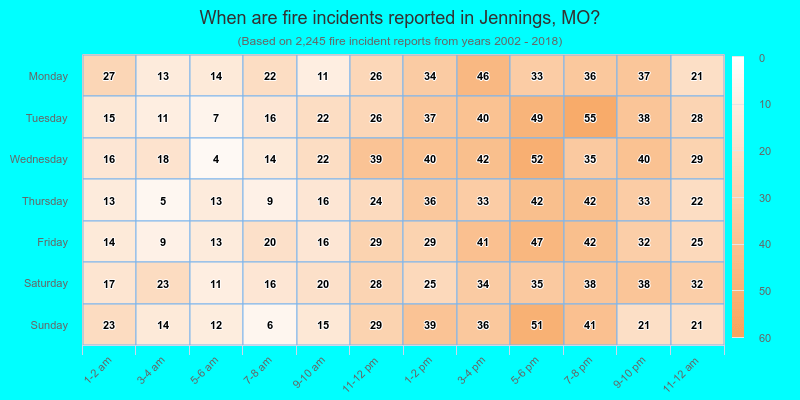
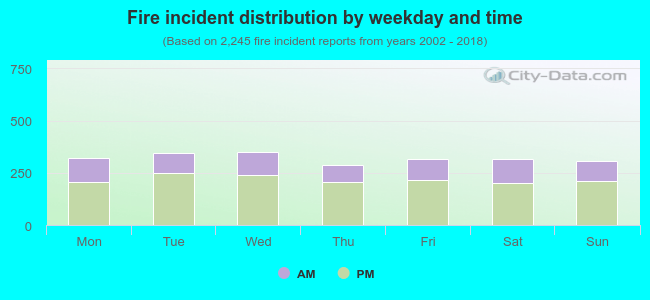 32.0% incidents where reported in the morning and 68.0% in the evening. The most fires (15.6%) took place on Wednesday, and the least (12.8%) on Thursday.
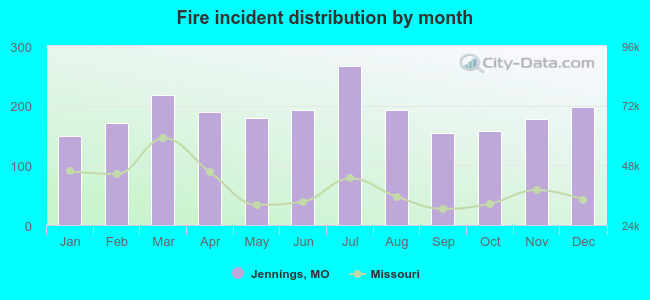 Based on the 2,245 reports from years 2002 - 2018 most fires (11.8%) took place during July, and the least (6.6%) in January.
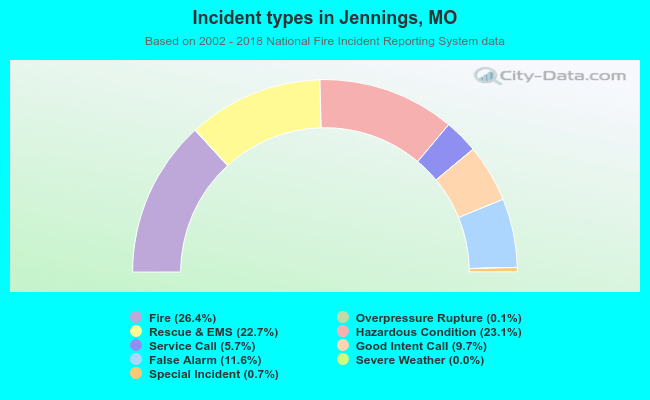 Out of all 8,505 cases reported during the years 2002 - 2018, the most belonged to the categories: Fire (26.4%), Hazardous Condition (23.1%), and Rescue & EMS (22.7%).
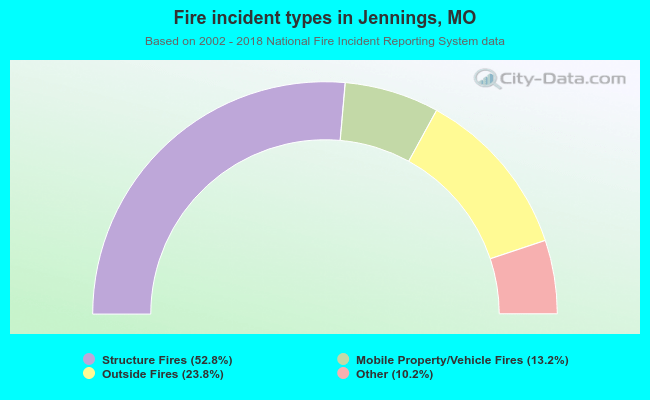 When looking into fire subcategories, the most reports belonged to: Structure Fires (52.8%), and Outside Fires (23.8%).