Ferguson: Fire Incidents, Missouri (MO)
Where are fire incidents reported in Ferguson, MO
Something went wrong! Please refresh the page.
| Fire incidents reported | |
|---|---|
| Sreet name | Count |
| FLORISSANT RD | 162 |
| FLORISSANT AVE | 148 |
| SHARONDALE CIR | 116 |
| NORTHWINDS ESTATES DR | 98 |
| DADE AVE | 84 |
| CADDIEFIELD RD | 80 |
| NORLAKES DR | 78 |
| CHAMBERS RD | 74 |
| NEW HALLS FERRY RD | 74 |
| PERSHALL RD | 72 |
| GLEN OWEN DR | 60 |
| FERGUSON AVE | 56 |
| ELIZABETH AVE | 50 |
| HARVEY AVE | 50 |
| WINDWARD CT | 48 |
| FORESTWOOD DR | 46 |
| WEST FLORISSANT AVE | 38 |
| AIRPORT RD | 36 |
| CLARK AVE | 34 |
| EXUMA DR | 34 |
| I-270 | 34 |
| INTERSTATE 270 | 34 |
| JANUARY AVE | 32 |
| MARGUERITE AVE | 32 |
| CHURCH ST | 30 |
| JOYCE ELLEN LANE | 30 |
| SMITH AVE | 30 |
| SUBURBAN AVE | 30 |
| CANFIELD | 28 |
| CARSON RD | 28 |
| Other | 486 |
2002 - 2018 National Fire Incident Reporting System (NFIRS) incidents
- Incident types reported to NFIRS in Ferguson, MO
- 6,33849.5%Rescue & EMS
- 2,23217.4%Fire
- 1,92115.0%Hazardous Condition
- 9427.4%False Alarm
- 7636.0%Service Call
- 5734.5%Good Intent Call
- 360.3%Special Incident
- Fire incident types reported to NFIRS in Ferguson, MO
- 1,04746.9%Structure Fires
- 63328.4%Outside Fires
- 28912.9%Mobile Property/Vehicle Fires
- 26311.8%Other
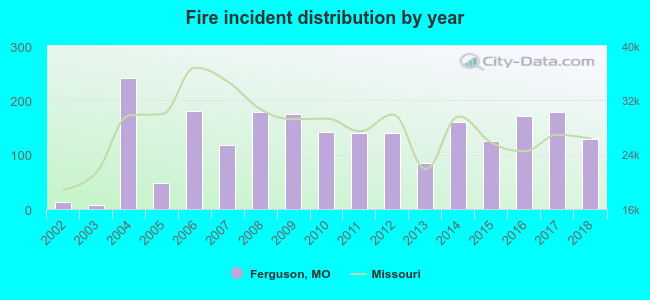 According to the data from the years 2002 - 2018 the average number of fires per year is 131. The highest number of fires - 242 took place in 2004, and the least - 7 in 2003. The data has an increasing trend.
The average number of yearly fire incidents per 10k residents in Ferguson, MO compared to nearest cities:
(Note: Based on data for the last 3 years, including only cities with population 5,000 and above)
| Ferguson: | 75.6 |
| Dellwood: | 51.9 |
| Berkeley: | 76.3 |
| Jennings: | 83.5 |
| Black Jack: | 7.2 |
| Florissant: | 45.0 |
| Hazelwood: | 29.2 |
| Overland: | 19.6 |
| Glasgow Village: | 7.4 |
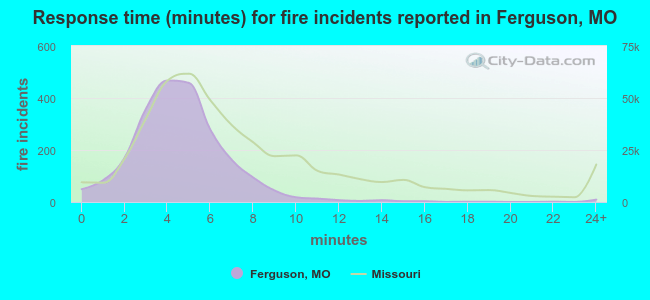 The median response time based on all reported fire incidents is 4 minutes. This is lower than the Missouri median value.
The median response time in Ferguson, MO compared to nearest cities:
(Note: Based on data for all years, including only cities with at least 500 fire incidents)
| Ferguson: | 4 minutes |
| Berkeley: | 4 minutes |
| Normandy: | 6 minutes |
| Jennings: | 4 minutes |
| Florissant: | 5 minutes |
| Hazelwood: | 6 minutes |
| Riverview: | 5 minutes |
| Overland: | 5 minutes |
| Spanish Lake: | 7 minutes |
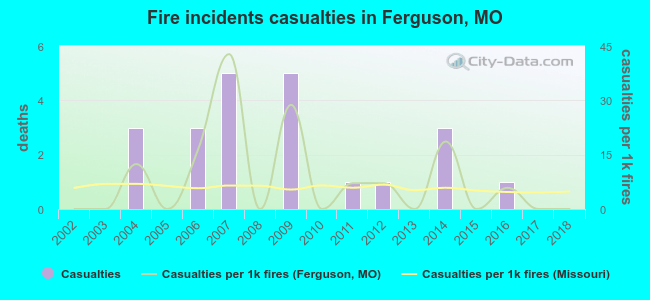 Based on the reports from the years 2002 - 2018 the average number of fire-related yearly casualties is 1. The highest number of reported casualties - 5 took place in 2007, and the lowest - 0 in 2002. The data has a constant trend.
The average number of injuries per 1,000 fire incidents is 8. This indicator was the highest - 43 in 2007, and the lowest 0 in 2002. The trend for casualties per 1,000 incidents is declining. Compared to the state value the number of casualties per 1,000 fires is higher.
Based on the reports from the years 2002 - 2018 the average number of fire-related yearly casualties is 1. The highest number of reported casualties - 5 took place in 2007, and the lowest - 0 in 2002. The data has a constant trend.
The average number of injuries per 1,000 fire incidents is 8. This indicator was the highest - 43 in 2007, and the lowest 0 in 2002. The trend for casualties per 1,000 incidents is declining. Compared to the state value the number of casualties per 1,000 fires is higher.Casualties per 1,000 incidents in Ferguson, MO compared to nearest cities:
(Note: Based on data for all years, including only cities with at least 500 fire incidents)
| Ferguson: | 9.9 |
| Berkeley: | 12.4 |
| Normandy: | 0.0 |
| Jennings: | 5.3 |
| Florissant: | 7.1 |
| Hazelwood: | 0.0 |
| Riverview: | 0.0 |
| Overland: | 3.6 |
| Spanish Lake: | 0.0 |
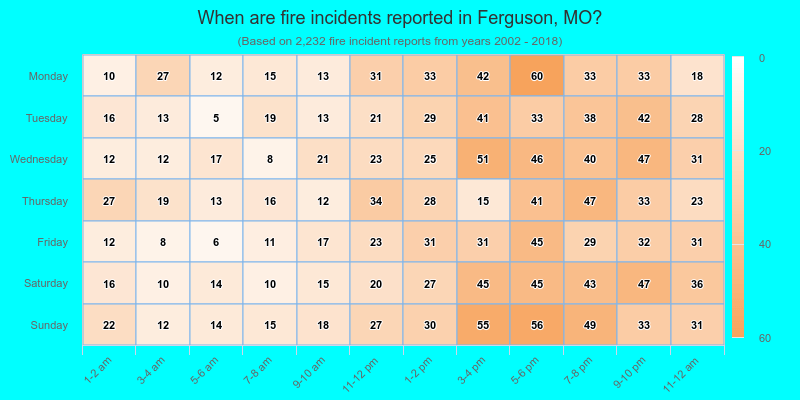
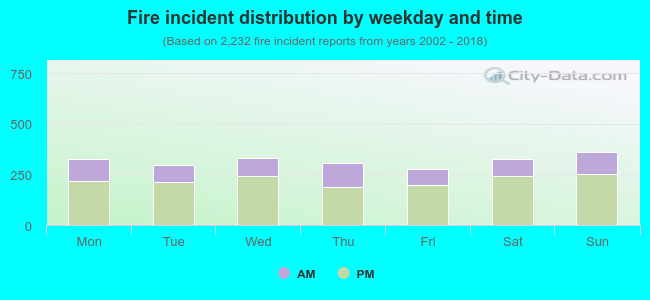 30.4% incidents where reported in the morning and 69.6% in the evening. The most fires (16.2%) took place on Sunday, and the least (12.4%) on Friday.
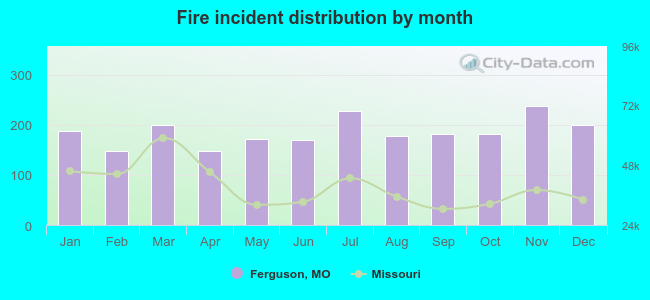 According to the 2,232 fire incident reports from years 2002 - 2018 most fires (10.7%) took place during November, and the least (6.6%) in February.
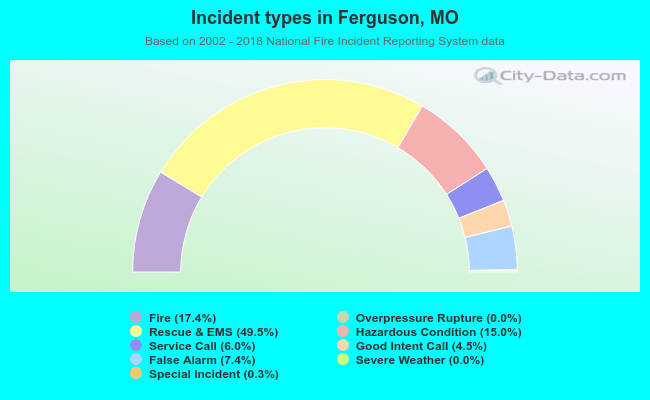 Out of all 12,810 cases reported during the years 2002 - 2018, the most belonged to the categories: Rescue & EMS (49.5%), Fire (17.4%), and Hazardous Condition (15.0%).
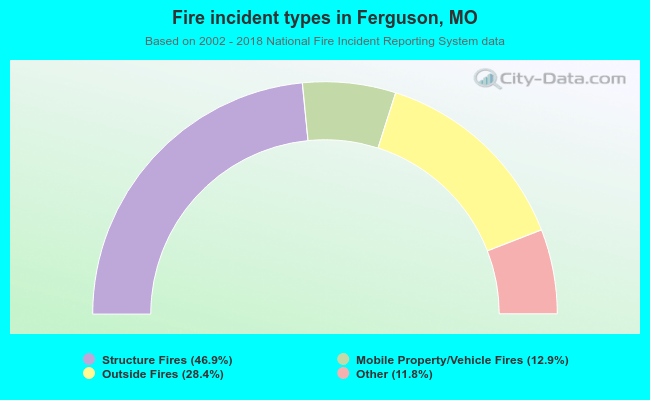 When looking into fire subcategories, the most incidents belonged to: Structure Fires (46.9%), and Outside Fires (28.4%).