Helena: Fire Incidents, Montana (MT)
Where are fire incidents reported in Helena, MT
Something went wrong! Please refresh the page.
| Fire incidents reported | |
|---|---|
| Sreet name | Count |
| MONTANA AVE | 82 |
| MONTANA | 64 |
| CANYON FERRY RD | 62 |
| INTERSTATE - 15 | 60 |
| EUCLID AVE | 56 |
| PROSPECT AVE | 56 |
| INTERSTATE 15 | 54 |
| LINCOLN | 54 |
| LAST CHANCE GULCH | 50 |
| 11TH AVE | 42 |
| BENTON AVE | 42 |
| YORK RD | 40 |
| BROADWAY ST | 38 |
| GREEN MEADOW | 38 |
| RODNEY ST | 36 |
| MCHUGH | 30 |
| 6TH AVE | 28 |
| APPLEGATE | 24 |
| SIERRA | 24 |
| BILLINGS AVE | 22 |
| BOULDER AVE | 22 |
| CANYON FERRY ROAD | 22 |
| CEDAR ST | 22 |
| JOHN G MINE | 22 |
| LYNDALE AVE | 20 |
| NATIONAL AVE | 20 |
| CANNON ST | 18 |
| CUSTER AVE | 18 |
| HELENA AVE | 18 |
| ORO FINO GULCH | 18 |
| Other | 1,370 |
2002 - 2018 National Fire Incident Reporting System (NFIRS) incidents
- Incident types reported to NFIRS in Helena, MT
- 16,39759.9%Rescue & EMS
- 3,33912.2%Hazardous Condition
- 2,4729.0%Fire
- 2,3558.6%Good Intent Call
- 1,7886.5%False Alarm
- 9413.4%Service Call
- 320.1%Special Incident
- Fire incident types reported to NFIRS in Helena, MT
- 1,19348.3%Outside Fires
- 86535.0%Structure Fires
- 32913.3%Mobile Property/Vehicle Fires
- 853.4%Other
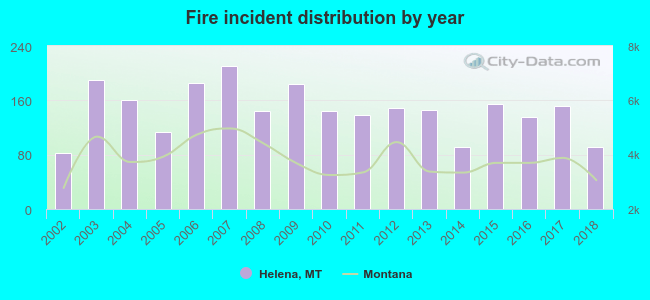 Based on the data from the years 2002 - 2018 the average number of fires per year is 145. The highest number of reported fires - 211 took place in 2007, and the least - 82 in 2002. The data has an increasing trend.
The average number of yearly fire incidents per 10k residents in Helena, MT compared to nearest cities:
(Note: Based on data for the last 3 years, including only cities with population 5,000 and above)
| Helena: | 42.2 |
| Butte: | 52.7 |
| Anaconda: | 23.2 |
| Belgrade: | 72.7 |
| Great Falls: | 25.2 |
 The median response time based on all reported fire incidents is 8 minutes. This is similar to the state median value.
The median response time in Helena, MT compared to nearest cities:
(Note: Based on data for all years, including only cities with at least 500 fire incidents)
| Helena: | 8 minutes |
| Butte: | 4 minutes |
| Three Forks: | 17 minutes |
| Belgrade: | 11 minutes |
| Great Falls: | 6 minutes |
 According to the data from the years 2002 - 2018 the average number of fire-related yearly deaths is 1. The highest number of deaths - 2 took place in 2011, and the lowest - 0 in 2002. The data has a constant trend.
 Based on the reports from the years 2002 - 2018 the average number of fire-related casualties per year is 1. The highest number of casualties - 3 took place in 2016, and the lowest - 0 in 2002. The data has a constant trend.
The average number of casualties per 1,000 fires is 3. This indicator was the highest - 22 in 2016, and the lowest 0 in 2002. The trend for injuries per 1,000 incidents is constant. Compared to the state value the number of injuries per 1,000 fire incidents is lower.
Based on the reports from the years 2002 - 2018 the average number of fire-related casualties per year is 1. The highest number of casualties - 3 took place in 2016, and the lowest - 0 in 2002. The data has a constant trend.
The average number of casualties per 1,000 fires is 3. This indicator was the highest - 22 in 2016, and the lowest 0 in 2002. The trend for injuries per 1,000 incidents is constant. Compared to the state value the number of injuries per 1,000 fire incidents is lower.Casualties per 1,000 incidents in Helena, MT compared to nearest cities:
(Note: Based on data for all years, including only cities with at least 500 fire incidents)
| Helena: | 3.6 |
| Butte: | 13.6 |
| Three Forks: | 0.0 |
| Belgrade: | 10.7 |
| Great Falls: | 15.1 |
 27.1% incidents where reported in the morning and 72.9% in the evening. The most fires (15.7%) took place on Monday, and the least (12.7%) on Wednesday.
 According to the 2,472 reports from years 2002 - 2018 most fires (19.9%) took place during July, and the least (4.8%) in November.
 Out of all 27,354 cases reported during the years 2002 - 2018, the most belonged to the categories: Rescue & EMS (59.9%), Hazardous Condition (12.2%), and Fire (9.0%).
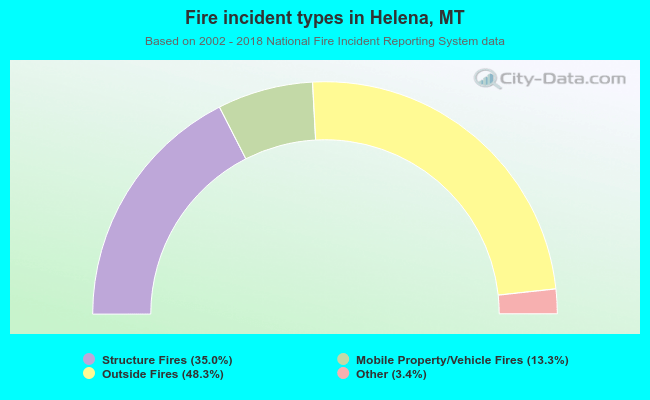 When looking into fire subcategories, the most reports belonged to: Outside Fires (48.3%), and Structure Fires (35.0%).