Butte: Fire Incidents, Montana (MT)
Where are fire incidents reported in Butte, MT
Something went wrong! Please refresh the page.
| Fire incidents reported | |
|---|---|
| Sreet name | Count |
| HARRISON AVE | 130 |
| MAIN ST | 120 |
| PARK ST | 72 |
| BROADWAY ST | 52 |
| MONTANA ST | 50 |
| GRANITE ST | 40 |
| BROWNS GULCH ROAD | 34 |
| EXCELSIOR AVE | 34 |
| WYOMING ST | 32 |
| LOCUST ST | 30 |
| CONTINENTAL DR | 26 |
| MAIN | 26 |
| BUSCH ST | 24 |
| MONTANA | 24 |
| QUARTZ ST | 24 |
| ROOSEVELT DRIVE | 24 |
| DAKOTA ST | 22 |
| I90 HWY | 22 |
| SILVER | 22 |
| WASHINGTON ST | 22 |
| CALEDONIA ST | 20 |
| FRONT ST | 20 |
| IDAHO ST | 20 |
| JACKSON ST | 20 |
| ARIZONA ST | 18 |
| COPPER ST | 18 |
| FARRELL ST | 18 |
| GOLD ST | 18 |
| HOBSON ST | 18 |
| UTAH ST | 18 |
| Other | 969 |
2002 - 2018 National Fire Incident Reporting System (NFIRS) incidents
- Incident types reported to NFIRS in Butte, MT
- 9,47558.5%Rescue & EMS
- 1,98712.3%Fire
- 1,69410.5%Hazardous Condition
- 1,2347.6%Good Intent Call
- 9005.6%False Alarm
- 8675.3%Service Call
- 260.2%Overpressure Rupture
- 170.1%Special Incident
- Fire incident types reported to NFIRS in Butte, MT
- 1,01451.0%Outside Fires
- 65633.0%Structure Fires
- 25913.0%Mobile Property/Vehicle Fires
- 582.9%Other
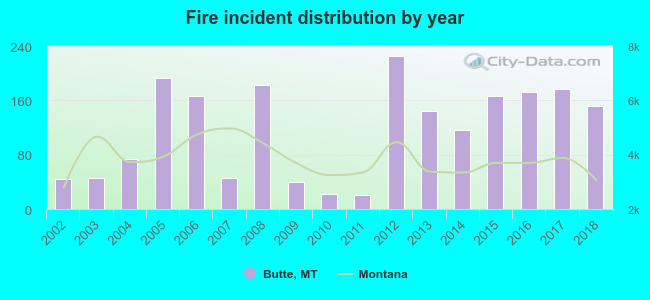 Based on the data from the years 2002 - 2018 the average number of fires per year is 117. The highest number of fire incidents - 225 took place in 2012, and the least - 20 in 2011. The data has a rising trend.
 The median response time based on all reported fire incidents is 4 minutes. This is much lower compared to the Montana median value.
The median response time in Butte, MT compared to nearest cities:
(Note: Based on data for all years, including only cities with at least 500 fire incidents)
| Butte: | 4 minutes |
| Three Forks: | 17 minutes |
| Helena: | 8 minutes |
| Belgrade: | 11 minutes |
| Bozeman: | 11 minutes |
| Hamilton: | 8 minutes |
| Stevensville: | 9 minutes |
 Based on the reports from the years 2002 - 2018 the average number of fire-related fatalities per year is 0. The highest number of deaths - 1 took place in 2002, and the lowest - 0 in 2003. The data has a dropping trend.
 Based on the data from the years 2002 - 2018 the average number of fire-related casualties per year is 2. The highest number of reported injuries - 5 took place in 2008, and the lowest - 0 in 2003. The data has a rising trend.
The average number of casualties per 1,000 fire incidents is 11. This indicator was the highest - 30 in 2015, and the lowest 0 in 2003. The trend for casualties per 1,000 fires is declining. Compared to the Montana value the number of casualties per 1,000 incidents is higher.
Based on the data from the years 2002 - 2018 the average number of fire-related casualties per year is 2. The highest number of reported injuries - 5 took place in 2008, and the lowest - 0 in 2003. The data has a rising trend.
The average number of casualties per 1,000 fire incidents is 11. This indicator was the highest - 30 in 2015, and the lowest 0 in 2003. The trend for casualties per 1,000 fires is declining. Compared to the Montana value the number of casualties per 1,000 incidents is higher.Casualties per 1,000 incidents in Butte, MT compared to nearest cities:
(Note: Based on data for all years, including only cities with at least 500 fire incidents)
| Butte: | 13.6 |
| Three Forks: | 0.0 |
| Helena: | 3.6 |
| Belgrade: | 10.7 |
| Bozeman: | 0.5 |
| Hamilton: | 14.1 |
| Stevensville: | 2.0 |
 30.1% incidents where reported in the morning and 69.9% in the evening. The most fires (16.1%) took place on Monday, and the least (13.2%) on Saturday.
 Based on the 1,987 incident reports from years 2002 - 2018 most fires (21.1%) took place during July, and the least (4.6%) in January.
 Out of all 16,206 cases reported during the years 2002 - 2018, the most belonged to the categories: Rescue & EMS (58.5%), Fire (12.3%), and Hazardous Condition (10.5%).
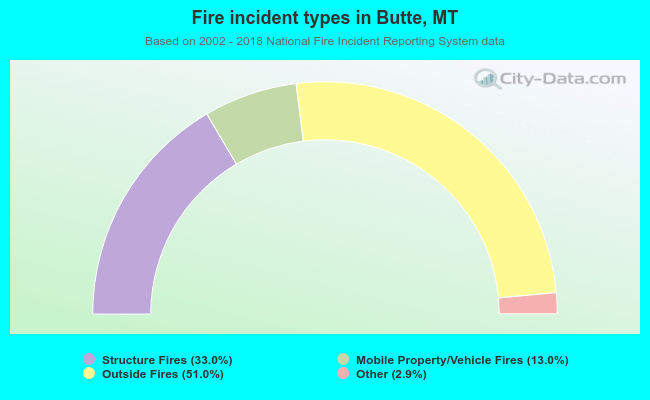 When looking into fire subcategories, the most reports belonged to: Outside Fires (51.0%), and Structure Fires (33.0%).