Grand Junction: Fire Incidents, Colorado (CO)
Where are fire incidents reported in Grand Junction, CO
Something went wrong! Please refresh the page.
| Fire incidents reported | |
|---|---|
| Sreet name | Count |
| NORTH AVE | 266 |
| 29 RD | 148 |
| BROADWAY | 138 |
| ORCHARD AVE | 108 |
| HORIZON DR | 94 |
| 7TH ST | 88 |
| 5TH ST | 86 |
| HWY 50 | 84 |
| MAIN ST | 80 |
| 25 RD | 76 |
| PATTERSON RD | 76 |
| 12TH ST | 70 |
| 22 RD | 70 |
| 30 RD | 68 |
| COLORADO AVE | 66 |
| F RD | 62 |
| GRAND AVE | 62 |
| 15TH ST | 60 |
| 24 RD | 60 |
| HWY 6 AND 50 | 60 |
| D RD | 58 |
| B 1/2 RD | 54 |
| G RD | 54 |
| ELM AVE | 52 |
| WHITE AVE | 52 |
| 23 RD | 50 |
| 29 1/2 RD | 50 |
| GUNNISON AVE | 50 |
| PITKIN AVE | 50 |
| 29 12 RD | 48 |
| Other | 1,801 |
2002 - 2018 National Fire Incident Reporting System (NFIRS) incidents
- Incident types reported to NFIRS in Grand Junction, CO
- 53,47372.1%Rescue & EMS
- 6,8379.2%Good Intent Call
- 4,1415.6%Fire
- 3,8775.2%Hazardous Condition
- 3,3874.6%Service Call
- 2,3453.2%False Alarm
- Fire incident types reported to NFIRS in Grand Junction, CO
- 1,85644.8%Outside Fires
- 1,58438.3%Structure Fires
- 50012.1%Mobile Property/Vehicle Fires
- 2014.9%Other
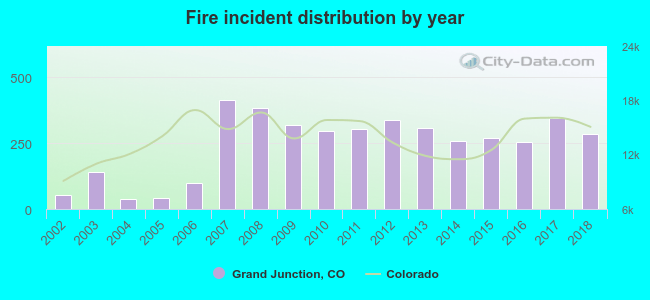 Based on the data from the years 2002 - 2018 the average number of fires per year is 244. The highest number of fires - 413 took place in 2007, and the least - 38 in 2004. The data has a growing trend.
The average number of yearly fire incidents per 10k residents in Grand Junction, CO compared to nearest cities:
(Note: Based on data for the last 3 years, including only cities with population 5,000 and above)
| Grand Junction: | 49.1 |
| Clifton: | 26.1 |
| Fruita: | 55.4 |
| Delta: | 26.4 |
| Grand Valley: | 1.6 |
| Rifle: | 44.3 |
| Montrose: | 83.0 |
| Glenwood Springs: | 27.4 |
| Carbondale: | 44.6 |
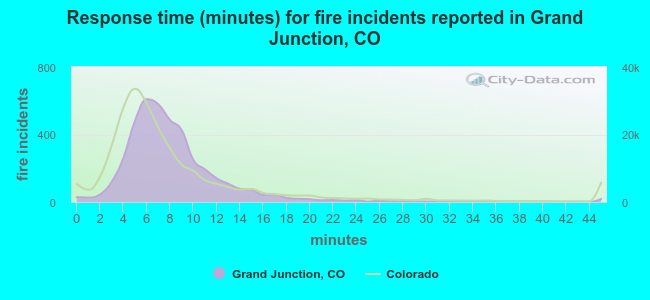 The median response time based on all reported fire incidents is 7 minutes. This is similar to the state median value.
The median response time in Grand Junction, CO compared to nearest cities:
(Note: Based on data for all years, including only cities with at least 500 fire incidents)
| Grand Junction: | 7 minutes |
| Clifton: | 6 minutes |
| Fruita: | 11 minutes |
| Parachute: | 11 minutes |
| Hotchkiss: | 10 minutes |
| Rifle: | 11 minutes |
| Montrose: | 8 minutes |
| Glenwood Springs: | 7 minutes |
| Carbondale: | 8 minutes |
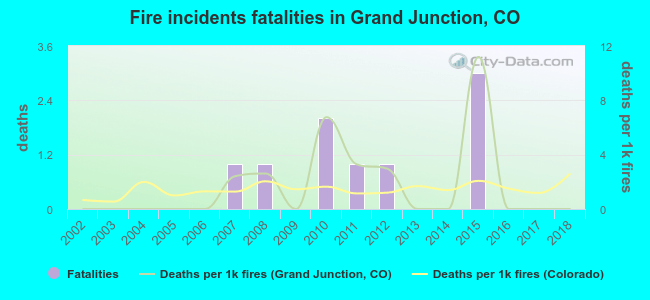 Based on the reports from the years 2002 - 2018 the average number of fire-related yearly deaths is 1. The highest number of reported deaths - 3 took place in 2015, and the lowest - 0 in 2002. The data has a constant trend.
The average number of deaths per 1,000 fires is 2. This indicator was the highest - 11 in 2015, and the lowest 0 in 2002. The trend for deaths per 1,000 fires is constant. Compared to the state value the number of deaths per 1,000 fires is higher.
Based on the reports from the years 2002 - 2018 the average number of fire-related yearly deaths is 1. The highest number of reported deaths - 3 took place in 2015, and the lowest - 0 in 2002. The data has a constant trend.
The average number of deaths per 1,000 fires is 2. This indicator was the highest - 11 in 2015, and the lowest 0 in 2002. The trend for deaths per 1,000 fires is constant. Compared to the state value the number of deaths per 1,000 fires is higher.Deaths per 1,000 incidents in Grand Junction, CO compared to nearest cities:
(Note: Based on data for all years, including only cities with at least 2,500 fire incidents)
| Grand Junction: | 2.2 |
| Montrose: | 2.7 |
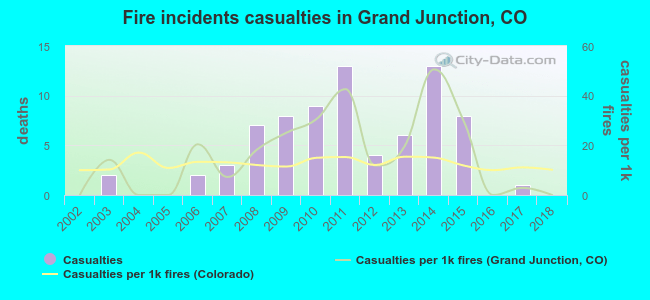 Based on the data from the years 2002 - 2018 the average number of fire-related casualties per year is 4. The highest number of casualties - 13 took place in 2011, and the lowest - 0 in 2002. The data has a constant trend.
The average number of casualties per 1,000 fire incidents is 16. This indicator was the highest - 51 in 2014, and the lowest 0 in 2002. The trend for injuries per 1,000 incidents is constant. Compared to the Colorado value the number of injuries per 1,000 fire incidents is higher.
Based on the data from the years 2002 - 2018 the average number of fire-related casualties per year is 4. The highest number of casualties - 13 took place in 2011, and the lowest - 0 in 2002. The data has a constant trend.
The average number of casualties per 1,000 fire incidents is 16. This indicator was the highest - 51 in 2014, and the lowest 0 in 2002. The trend for injuries per 1,000 incidents is constant. Compared to the Colorado value the number of injuries per 1,000 fire incidents is higher.Casualties per 1,000 incidents in Grand Junction, CO compared to nearest cities:
(Note: Based on data for all years, including only cities with at least 500 fire incidents)
| Grand Junction: | 18.4 |
| Clifton: | 3.0 |
| Fruita: | 1.8 |
| Parachute: | 0.0 |
| Hotchkiss: | 0.0 |
| Rifle: | 0.0 |
| Montrose: | 13.9 |
| Glenwood Springs: | 6.0 |
| Carbondale: | 1.2 |
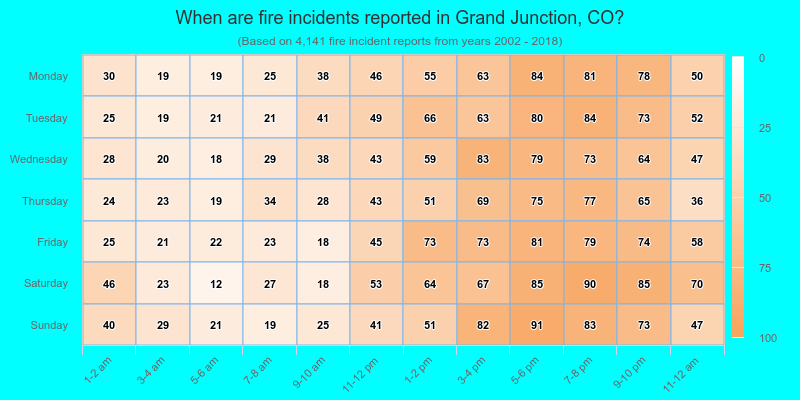
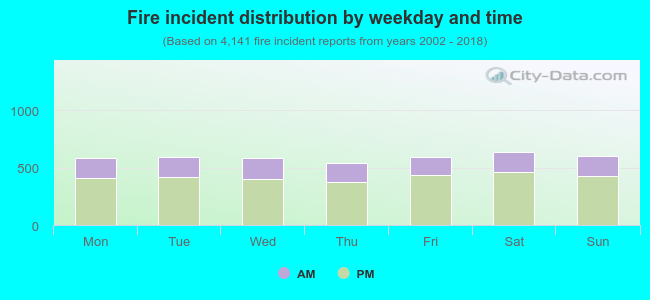 29.2% incidents where reported in the morning and 70.8% in the evening. The most fires (15.5%) took place on Saturday, and the least (13.1%) on Thursday.
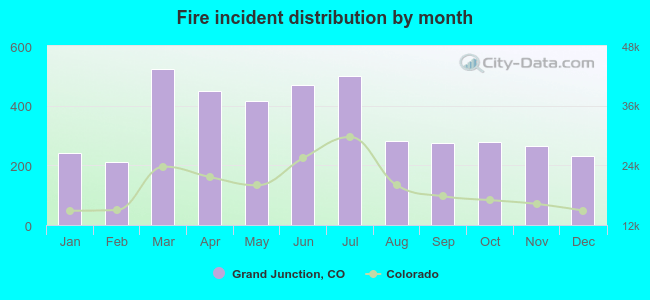 According to the 4,141 fires from years 2002 - 2018 most fires (12.7%) took place during March, and the least (5.1%) in February.
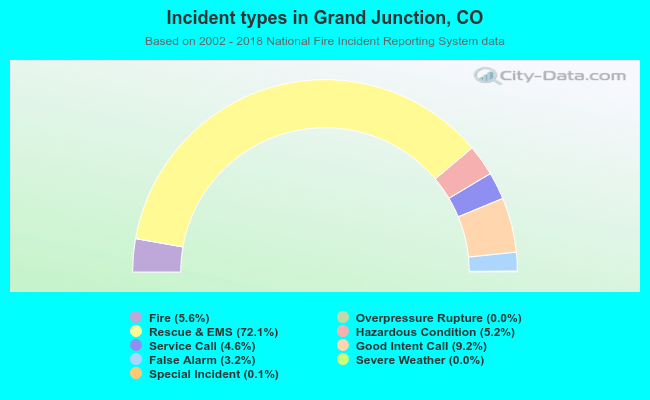 Out of all 74,151 cases reported during the years 2002 - 2018, the most belonged to the categories: Rescue & EMS (72.1%), Good Intent Call (9.2%), and Fire (5.6%).
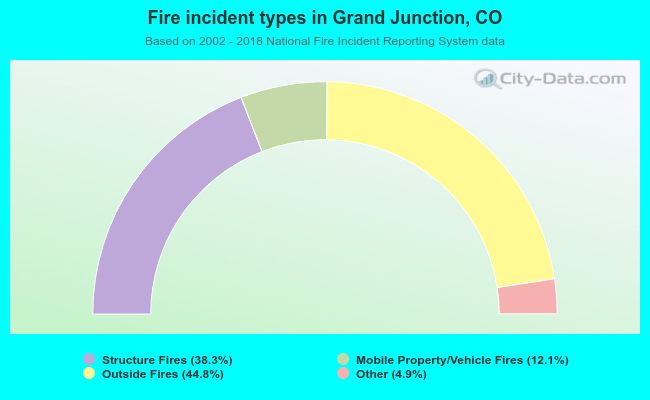 When looking into fire subcategories, the most reports belonged to: Outside Fires (44.8%), and Structure Fires (38.3%).