Fruita: Fire Incidents, Colorado (CO)
Where are fire incidents reported in Fruita, CO
Something went wrong! Please refresh the page.
| Fire incidents reported | |
|---|---|
| Sreet name | Count |
| 19 RD | 86 |
| 20 RD | 76 |
| 18 RD | 66 |
| J RD | 54 |
| 16 RD | 52 |
| HWY 6 AND 50 | 48 |
| 21 RD | 40 |
| K RD | 40 |
| L RD | 40 |
| 17 12 RD | 30 |
| OTTLEY AVE | 30 |
| MAPLE ST | 28 |
| ASPEN AVE | 26 |
| 17 RD | 24 |
| FRONTAGE RD | 24 |
| 18 1/2 RD | 18 |
| M RD | 18 |
| PABOR AVE | 18 |
| PINE ST | 18 |
| 22 RD | 16 |
| COULSON ST | 16 |
| MESA ST | 16 |
| WILDCAT AVE | 16 |
| 17 1/2 RD | 14 |
| 18 12 RD | 14 |
| 6 HWY | 14 |
| I RD | 14 |
| HWY 340 | 12 |
| HWY 6 | 12 |
| K 610 RD | 12 |
| Other | 231 |
2005 - 2018 National Fire Incident Reporting System (NFIRS) incidents
- Incident types reported to NFIRS in Fruita, CO
- 4,49558.5%Rescue & EMS
- 1,12314.6%Fire
- 83210.8%Good Intent Call
- 5357.0%Hazardous Condition
- 4395.7%Service Call
- 2403.1%False Alarm
- Fire incident types reported to NFIRS in Fruita, CO
- 70362.6%Outside Fires
- 26924.0%Structure Fires
- 786.9%Other
- 736.5%Mobile Property/Vehicle Fires
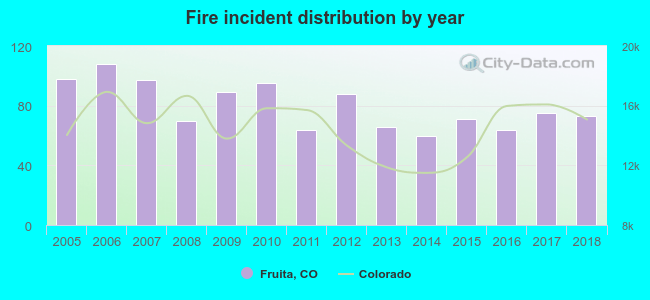 According to the data from the years 2005 - 2018 the average number of fires per year is 80. The highest number of fires - 108 took place in 2006, and the least - 60 in 2014. The data has a dropping trend.
The average number of yearly fire incidents per 10k residents in Fruita, CO compared to nearest cities:
(Note: Based on data for the last 3 years, including only cities with population 5,000 and above)
| Fruita: | 55.4 |
| Grand Junction: | 49.1 |
| Clifton: | 26.1 |
| Grand Valley: | 1.6 |
| Delta: | 26.4 |
| Rifle: | 44.3 |
| Montrose: | 83.0 |
| Glenwood Springs: | 27.4 |
| Carbondale: | 44.6 |
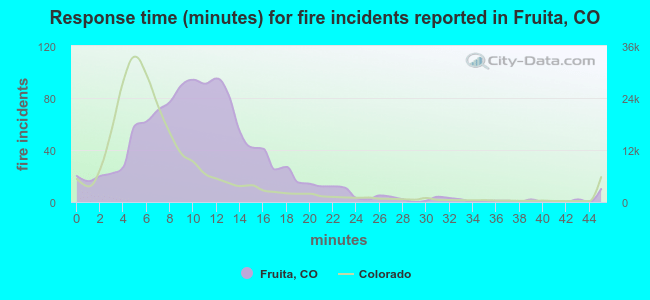 The median response time based on all reported fire incidents is 11 minutes. This is higher compared to the Colorado median value.
The median response time in Fruita, CO compared to nearest cities:
(Note: Based on data for all years, including only cities with at least 500 fire incidents)
| Fruita: | 11 minutes |
| Grand Junction: | 7 minutes |
| Clifton: | 6 minutes |
| Parachute: | 11 minutes |
| Rifle: | 11 minutes |
| Hotchkiss: | 10 minutes |
| Montrose: | 8 minutes |
| Glenwood Springs: | 7 minutes |
| Carbondale: | 8 minutes |
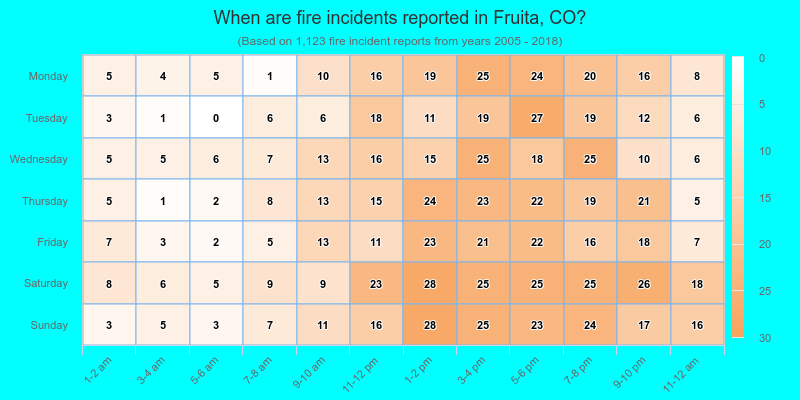
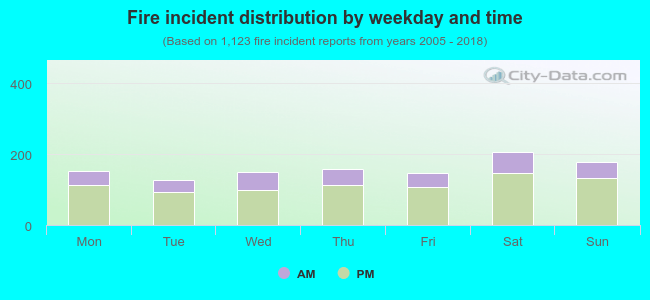 28.2% incidents where reported in the morning and 71.8% in the evening. The most fires (18.4%) took place on Saturday, and the least (11.4%) on Tuesday.
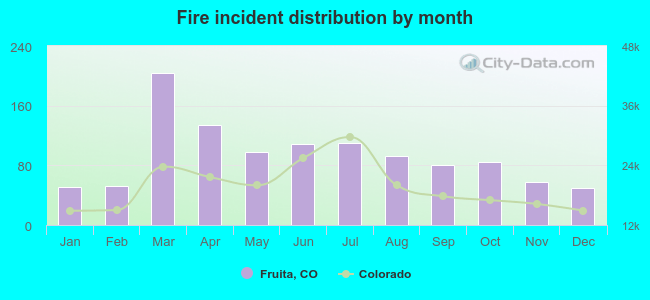 Based on the 1,123 fires from years 2005 - 2018 most fires (18.2%) took place during March, and the least (4.5%) in December.
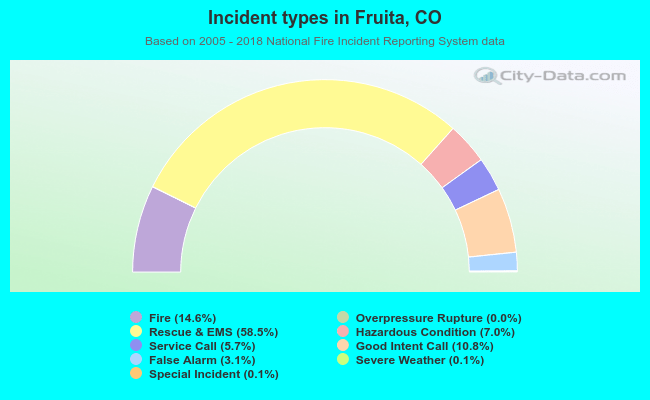 Out of all 7,678 cases reported during the years 2005 - 2018, the most belonged to the categories: Rescue & EMS (58.5%), Fire (14.6%), and Good Intent Call (10.8%).
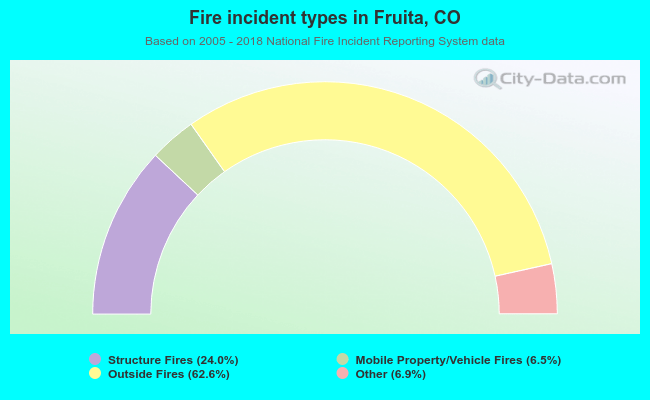 When looking into fire subcategories, the most incidents belonged to: Outside Fires (62.6%), and Structure Fires (24.0%).