Fox Lake: Fire Incidents, Illinois (IL)
Where are fire incidents reported in Fox Lake, IL
Something went wrong! Please refresh the page.
|
| |||||||||||||||||||||||||||||||||||||||||||||||||||||||||||||||||||||||||||||||||||||||||||||||||||||||||||||
| Other | 68 | |||||||||||||||||||||||||||||||||||||||||||||||||||||||||||||||||||||||||||||||||||||||||||||||||||||||||||||
2002 - 2018 National Fire Incident Reporting System (NFIRS) incidents
- Incident types reported to NFIRS in Fox Lake, IL
- 5,85765.0%Rescue & EMS
- 91610.2%Service Call
- 8119.0%Hazardous Condition
- 7027.8%Fire
- 4815.3%False Alarm
- 2162.4%Good Intent Call
- 160.2%Special Incident
- Fire incident types reported to NFIRS in Fox Lake, IL
- 36251.6%Structure Fires
- 25436.2%Outside Fires
- 699.8%Mobile Property/Vehicle Fires
- 172.4%Other
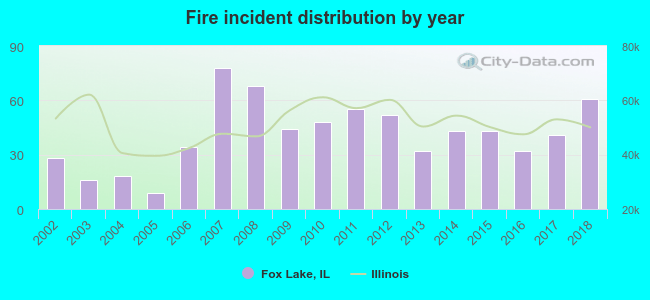 Based on the data from the years 2002 - 2018 the average number of fires per year is 41. The highest number of fire incidents - 78 took place in 2007, and the least - 9 in 2005. The data has a rising trend.
The average number of yearly fire incidents per 10k residents in Fox Lake, IL compared to nearest cities:
(Note: Based on data for the last 3 years, including only cities with population 5,000 and above)
| Fox Lake: | 42.2 |
| Johnsburg: | 24.4 |
| Lakemoor: | 28.3 |
| Spring Grove: | 71.0 |
| Lake Villa: | 38.1 |
| Round Lake Beach: | 17.4 |
| Round Lake: | 33.3 |
| Round Lake Park: | 11.3 |
| McHenry: | 43.8 |
 The median response time based on all reported fire incidents is 6 minutes. This is comparable to the state median value.
The median response time in Fox Lake, IL compared to nearest cities:
(Note: Based on data for all years, including only cities with at least 500 fire incidents)
| Fox Lake: | 6 minutes |
| Spring Grove: | 6 minutes |
| Lake Villa: | 7 minutes |
| Round Lake Beach: | 4 minutes |
| Round Lake: | 5 minutes |
| McHenry: | 5 minutes |
| Antioch: | 8 minutes |
| Grayslake: | 6 minutes |
| Richmond: | 6 minutes |
 28.6% incidents where reported in the morning and 71.4% in the evening. The most fires (19.8%) took place on Saturday, and the least (12.1%) on Tuesday.
 According to the 702 fires from years 2002 - 2018 most fires (14.2%) took place during April, and the least (6.3%) in November.
 Out of all 9,006 cases reported during the years 2002 - 2018, the most belonged to the categories: Rescue & EMS (65.0%), Service Call (10.2%), and Hazardous Condition (9.0%).
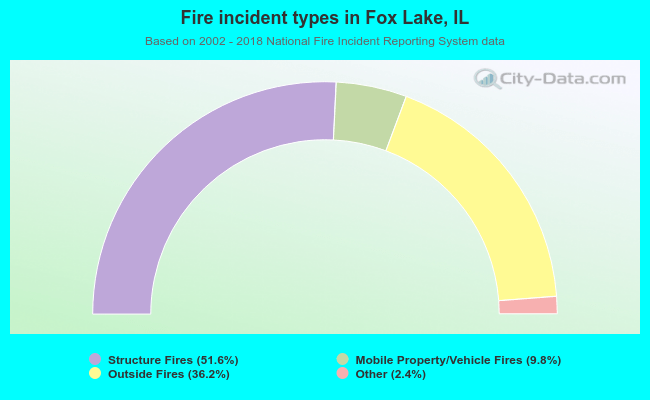 When looking into fire subcategories, the most reports belonged to: Structure Fires (51.6%), and Outside Fires (36.2%).