Antioch: Fire Incidents, Illinois (IL)
Where are fire incidents reported in Antioch, IL
Something went wrong! Please refresh the page.
| Fire incidents reported | |
|---|---|
| Sreet name | Count |
| MAIN ST | 116 |
| RTE 173 | 94 |
| GRASS LAKE RD | 54 |
| ROUTE 173 | 48 |
| NORTH AVE | 40 |
| ANITA AVE | 26 |
| DEEP LAKE RD | 26 |
| LAKE AVE | 24 |
| PROSPECT AVE | 24 |
| ORCHARD ST | 22 |
| DREXEL BLVD | 20 |
| LAKESIDE PL | 20 |
| TIFFANY RD | 20 |
| LAKE ST | 18 |
| HOLBECK DR | 16 |
| JOANNA CT | 16 |
| SPRING GROVE RD | 16 |
| LAKE SHORE DR | 14 |
| RT 173 | 14 |
| RTE 83 | 14 |
| WOODBINE AVE | 14 |
| DREXEL | 12 |
| HILLSIDE AVE | 12 |
| HWY 173 | 12 |
| LINCOLN AVE | 12 |
| LOTUS AVE | 12 |
| MILLER RD | 12 |
| ROUTE 83 | 12 |
| SAVAGE RD | 12 |
| ANITA TER | 10 |
| Other | 215 |
2002 - 2018 National Fire Incident Reporting System (NFIRS) incidents
- Incident types reported to NFIRS in Antioch, IL
- 8,10863.5%Rescue & EMS
- 1,34710.5%Hazardous Condition
- 1,2129.5%False Alarm
- 9777.6%Fire
- 8366.5%Service Call
- 2712.1%Good Intent Call
- Fire incident types reported to NFIRS in Antioch, IL
- 49150.3%Structure Fires
- 36437.3%Outside Fires
- 10510.7%Mobile Property/Vehicle Fires
- 171.7%Other
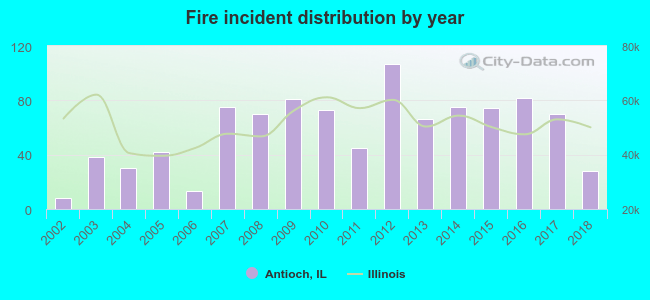 According to the data from the years 2002 - 2018 the average number of fire incidents per year is 57. The highest number of reported fire incidents - 107 took place in 2012, and the least - 8 in 2002. The data has an increasing trend.
The average number of yearly fire incidents per 10k residents in Antioch, IL compared to nearest cities:
(Note: Based on data for the last 3 years, including only cities with population 5,000 and above)
| Antioch: | 41.6 |
| Lake Villa: | 38.1 |
| Lindenhurst: | 8.1 |
| Fox Lake: | 42.2 |
| Round Lake Beach: | 17.4 |
| Spring Grove: | 71.0 |
| Round Lake: | 33.3 |
| Round Lake Park: | 11.3 |
| Grayslake: | 33.6 |
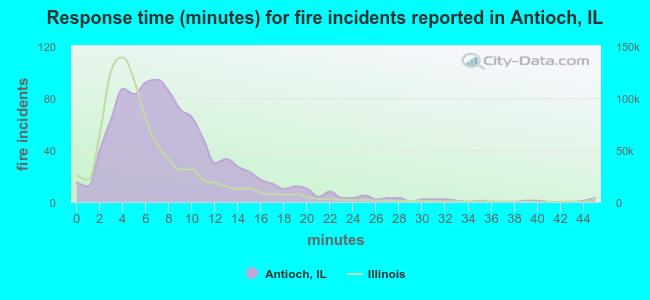 The median response time based on all reported fire incidents is 8 minutes. This is higher compared to the Illinois median value.
The median response time in Antioch, IL compared to nearest cities:
(Note: Based on data for all years, including only cities with at least 500 fire incidents)
| Antioch: | 8 minutes |
| Lake Villa: | 7 minutes |
| Fox Lake: | 6 minutes |
| Round Lake Beach: | 4 minutes |
| Spring Grove: | 6 minutes |
| Round Lake: | 5 minutes |
| Wadsworth: | 7 minutes |
| Grayslake: | 6 minutes |
| Gurnee: | 6 minutes |
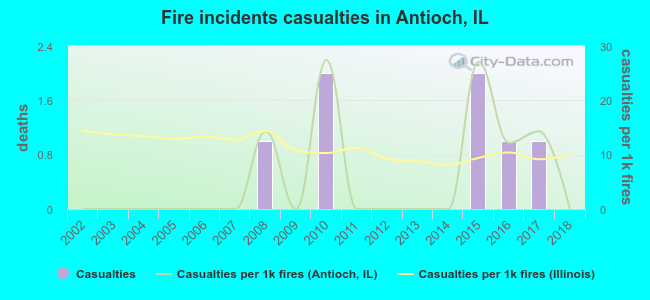 Based on the reports from the years 2002 - 2018 the average number of fire-related yearly casualties is 0. The highest number of reported casualties - 2 took place in 2010, and the lowest - 0 in 2002. The data has a constant trend.
The average number of injuries per 1,000 fires is 6. This indicator was the highest - 27 in 2010, and the lowest 0 in 2002. The trend for casualties per 1,000 incidents is dropping. Compared to the Illinois value the number of casualties per 1,000 fire incidents is lower.
Based on the reports from the years 2002 - 2018 the average number of fire-related yearly casualties is 0. The highest number of reported casualties - 2 took place in 2010, and the lowest - 0 in 2002. The data has a constant trend.
The average number of injuries per 1,000 fires is 6. This indicator was the highest - 27 in 2010, and the lowest 0 in 2002. The trend for casualties per 1,000 incidents is dropping. Compared to the Illinois value the number of casualties per 1,000 fire incidents is lower.Casualties per 1,000 incidents in Antioch, IL compared to nearest cities:
(Note: Based on data for all years, including only cities with at least 500 fire incidents)
| Antioch: | 7.2 |
| Lake Villa: | 9.6 |
| Fox Lake: | 2.8 |
| Round Lake Beach: | 21.8 |
| Spring Grove: | 2.5 |
| Round Lake: | 14.2 |
| Wadsworth: | 5.1 |
| Grayslake: | 15.9 |
| Gurnee: | 25.4 |
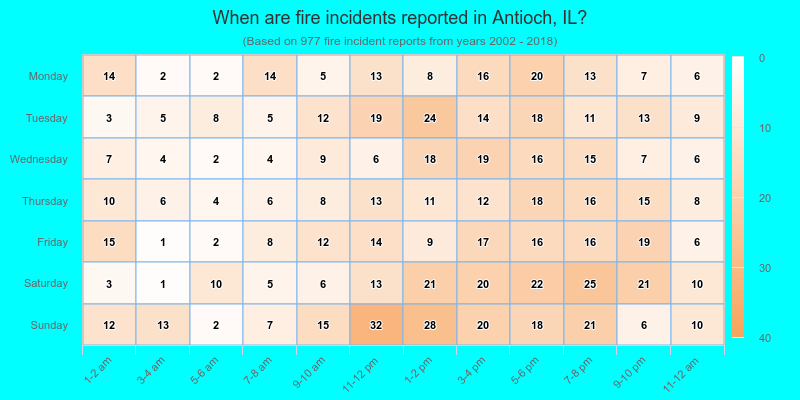
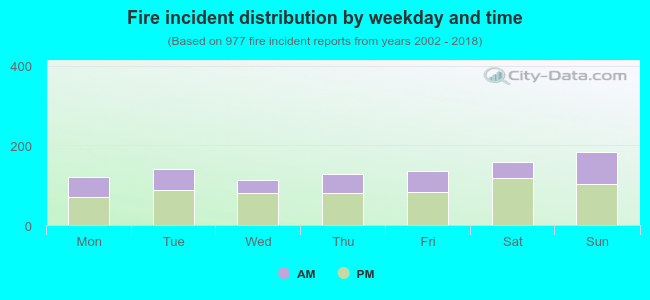 36.0% incidents where reported in the morning and 64.0% in the evening. The most fires (18.8%) took place on Sunday, and the least (11.6%) on Wednesday.
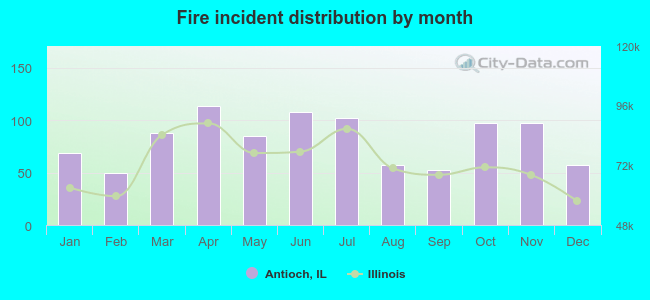 Based on the 977 fires from years 2002 - 2018 most fires (11.7%) took place during April, and the least (5.1%) in February.
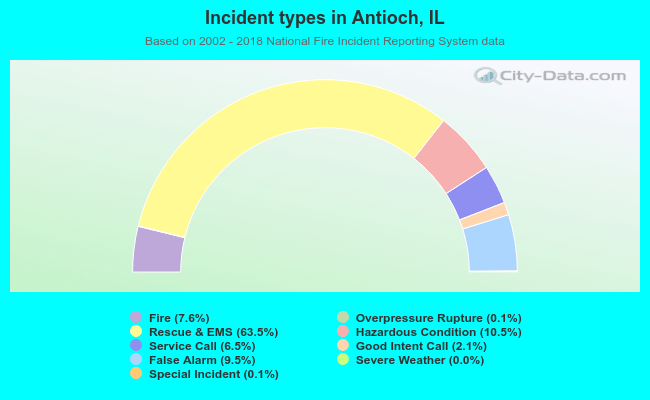 Out of all 12,776 cases reported during the years 2002 - 2018, the most belonged to the categories: Rescue & EMS (63.5%), Hazardous Condition (10.5%), and False Alarm (9.5%).
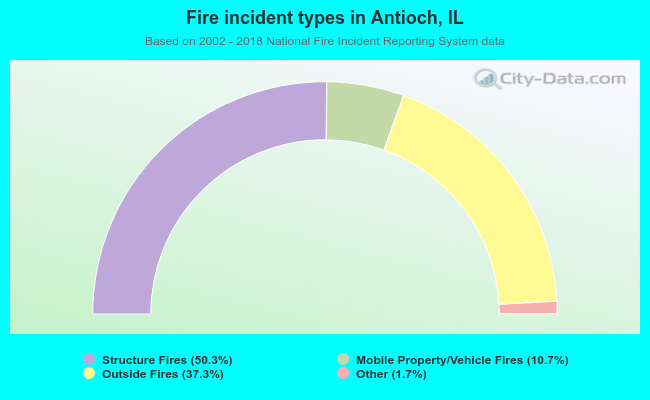 When looking into fire subcategories, the most reports belonged to: Structure Fires (50.3%), and Outside Fires (37.3%).