Fort Morgan: Fire Incidents, Colorado (CO)
Where are fire incidents reported in Fort Morgan, CO
Something went wrong! Please refresh the page.
|
| |||||||||||||||||||||||||||||||||||||||||||||||||||||||||||||||||||||||||||||||||||||||||||||||||||||||||||||
2002 - 2018 National Fire Incident Reporting System (NFIRS) incidents
- Incident types reported to NFIRS in Fort Morgan, CO
- 1,30433.9%Fire
- 83021.6%Rescue & EMS
- 80120.8%Good Intent Call
- 69318.0%Hazardous Condition
- 1945.0%False Alarm
- 180.5%Service Call
- Fire incident types reported to NFIRS in Fort Morgan, CO
- 85265.3%Outside Fires
- 24819.0%Structure Fires
- 17013.0%Mobile Property/Vehicle Fires
- 342.6%Other
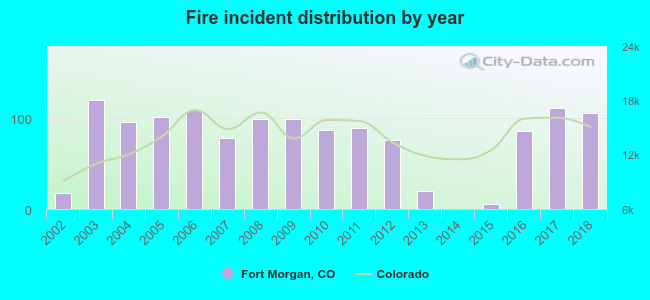 According to the data from the years 2002 - 2018 the average number of fires per year is 77. The highest number of fire incidents - 120 took place in 2003, and the least - 0 in 2014. The data has a rising trend.
The average number of yearly fire incidents per 10k residents in Fort Morgan, CO compared to nearest cities:
(Note: Based on data for the last 3 years, including only cities with population 5,000 and above)
| Fort Morgan: | 89.4 |
| Brush: | 81.1 |
| Sterling: | 46.5 |
| Evans: | 35.8 |
| Greeley: | 21.7 |
| Lochbuie: | 35.2 |
| Fort Lupton: | 77.9 |
| Milliken: | 36.7 |
| Brighton: | 35.8 |
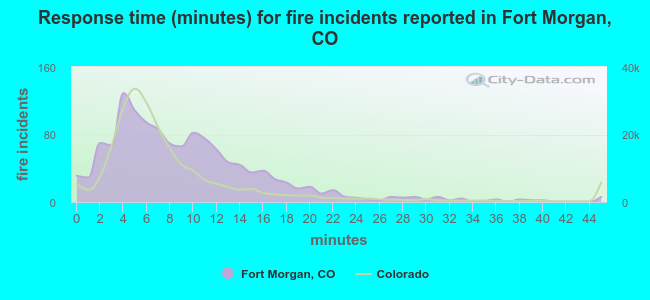 The median response time based on all reported fire incidents is 8 minutes. This is higher than the state median value.
The median response time in Fort Morgan, CO compared to nearest cities:
(Note: Based on data for all years, including only cities with at least 500 fire incidents)
| Fort Morgan: | 8 minutes |
| Sterling: | 6 minutes |
| Kersey: | 10 minutes |
| Byers: | 14 minutes |
| Bennett: | 10 minutes |
| Evans: | 6 minutes |
| Greeley: | 7 minutes |
| Eaton: | 8 minutes |
| Platteville: | 9 minutes |
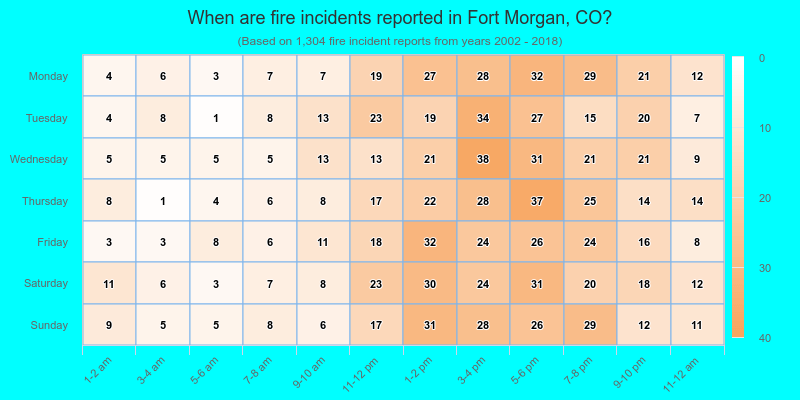
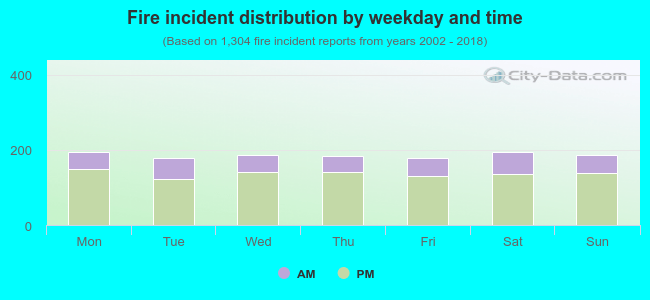 26.8% incidents where reported in the morning and 73.2% in the evening. The most fires (15.0%) took place on Monday, and the least (13.7%) on Tuesday.
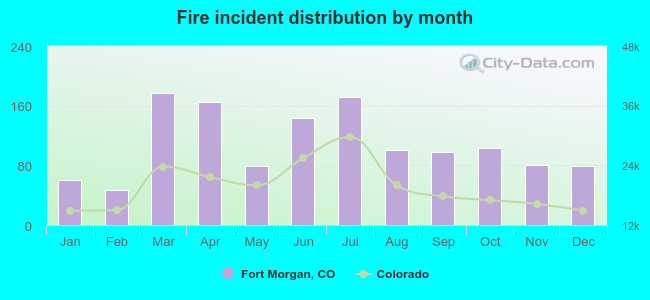 Based on the 1,304 fire incidents from years 2002 - 2018 most fires (13.6%) took place during March, and the least (3.6%) in February.
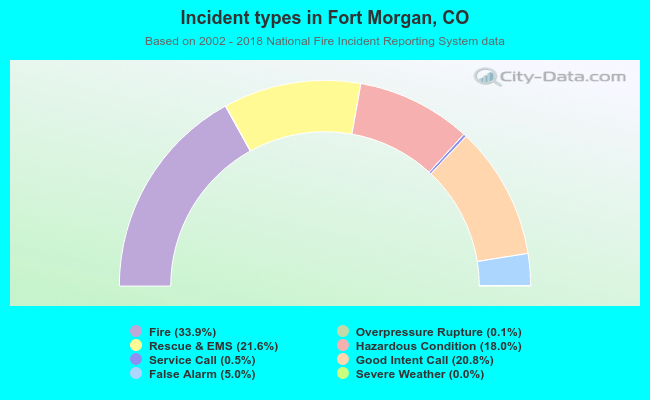 Out of all 3,843 cases reported during the years 2002 - 2018, the most belonged to the categories: Fire (33.9%), Rescue & EMS (21.6%), and Good Intent Call (20.8%).
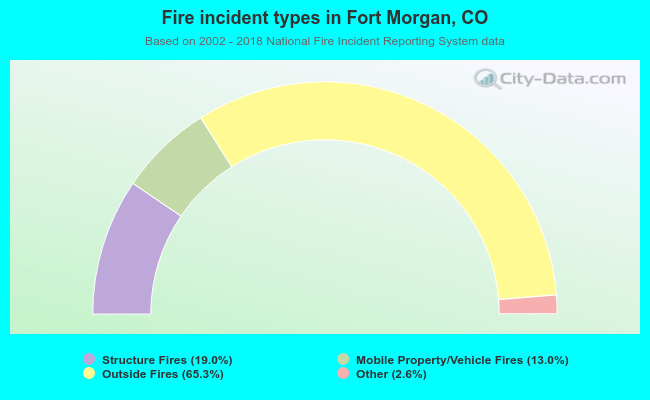 When looking into fire subcategories, the most reports belonged to: Outside Fires (65.3%), and Structure Fires (19.0%).