Brighton: Fire Incidents, Colorado (CO)
Where are fire incidents reported in Brighton, CO
Something went wrong! Please refresh the page.
| Fire incidents reported | |
|---|---|
| Sreet name | Count |
| BRIDGE ST | 204 |
| BROMLEY LN | 144 |
| INTERSTATE 76 | 126 |
| 160TH AVE | 122 |
| 152ND AVE | 102 |
| 144TH AVE | 86 |
| BRIGHTON RD | 86 |
| 168TH AVE | 70 |
| 136TH AVE | 64 |
| MAIN ST | 64 |
| 120TH AVE | 60 |
| COUNTY ROAD 4 | 58 |
| 11TH AVE | 56 |
| MILLER AVE | 54 |
| SOUTHERN ST | 54 |
| 8TH AVE | 52 |
| 4TH AVE | 48 |
| COUNTY ROAD 2 | 46 |
| 10TH AVE | 44 |
| 7TH AVE | 44 |
| SABLE BLVD | 42 |
| 18TH AVE | 40 |
| RIVERDALE RD | 40 |
| 3RD AVE | 36 |
| EGBERT ST | 36 |
| JESSUP ST | 36 |
| QUEBEC ST | 36 |
| KUNER RD | 34 |
| 128TH AVE | 32 |
| COUNTY ROAD 6 | 32 |
| Other | 185 |
2004 - 2018 National Fire Incident Reporting System (NFIRS) incidents
- Incident types reported to NFIRS in Brighton, CO
- 14,03861.7%Rescue & EMS
- 2,1339.4%Fire
- 2,0629.1%Hazardous Condition
- 1,9198.4%Good Intent Call
- 1,5516.8%Service Call
- 1,0174.5%False Alarm
- Fire incident types reported to NFIRS in Brighton, CO
- 1,14953.9%Outside Fires
- 59627.9%Structure Fires
- 36617.2%Mobile Property/Vehicle Fires
- 221.0%Other
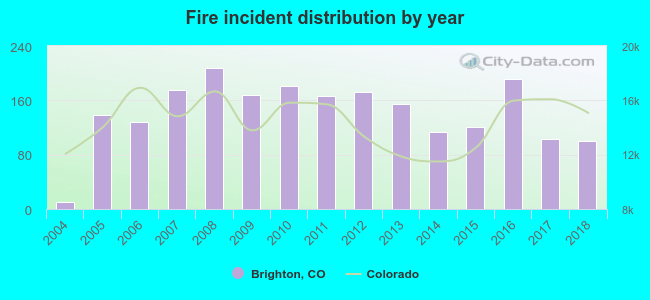 According to the data from the years 2004 - 2018 the average number of fire incidents per year is 142. The highest number of fires - 207 took place in 2008, and the least - 10 in 2004. The data has a growing trend.
The average number of yearly fire incidents per 10k residents in Brighton, CO compared to nearest cities:
(Note: Based on data for the last 3 years, including only cities with population 5,000 and above)
| Brighton: | 35.8 |
| Lochbuie: | 35.2 |
| Fort Lupton: | 77.9 |
| Thornton: | 21.3 |
| Commerce City: | 24.8 |
| Northglenn: | 25.4 |
| Welby: | 0.7 |
| Frederick: | 21.7 |
| Firestone: | 34.4 |
 The median response time based on all reported fire incidents is 6 minutes. This is similar to the Colorado median value.
The median response time in Brighton, CO compared to nearest cities:
(Note: Based on data for all years, including only cities with at least 500 fire incidents)
| Brighton: | 6 minutes |
| Fort Lupton: | 8 minutes |
| Thornton: | 7 minutes |
| Commerce City: | 5 minutes |
| Northglenn: | 6 minutes |
| Federal Heights: | 5 minutes |
| Broomfield: | 6 minutes |
| Erie: | 7 minutes |
| Westminster: | 5 minutes |
 According to the reports from the years 2004 - 2018 the average number of fire-related yearly casualties is 1. The highest number of reported casualties - 2 took place in 2008, and the lowest - 0 in 2004. The data has a rising trend.
The average number of injuries per 1,000 fires is 4. This indicator was the highest - 10 in 2018, and the lowest 0 in 2004. The trend for injuries per 1,000 fires is rising. Compared to the state value the number of injuries per 1,000 incidents is much lower.
According to the reports from the years 2004 - 2018 the average number of fire-related yearly casualties is 1. The highest number of reported casualties - 2 took place in 2008, and the lowest - 0 in 2004. The data has a rising trend.
The average number of injuries per 1,000 fires is 4. This indicator was the highest - 10 in 2018, and the lowest 0 in 2004. The trend for injuries per 1,000 fires is rising. Compared to the state value the number of injuries per 1,000 incidents is much lower.Casualties per 1,000 incidents in Brighton, CO compared to nearest cities:
(Note: Based on data for all years, including only cities with at least 500 fire incidents)
| Brighton: | 4.2 |
| Fort Lupton: | 7.5 |
| Thornton: | 13.9 |
| Commerce City: | 12.1 |
| Northglenn: | 9.4 |
| Federal Heights: | 21.2 |
| Broomfield: | 11.7 |
| Erie: | 4.6 |
| Westminster: | 34.0 |
 28.1% incidents where reported in the morning and 71.9% in the evening. The most fires (15.6%) took place on Saturday, and the least (12.9%) on Thursday.
 Based on the 2,133 fires from years 2004 - 2018 most fires (14.6%) took place during July, and the least (5.4%) in December.
 Out of all 22,750 cases reported during the years 2004 - 2018, the most belonged to the categories: Rescue & EMS (61.7%), Fire (9.4%), and Hazardous Condition (9.1%).
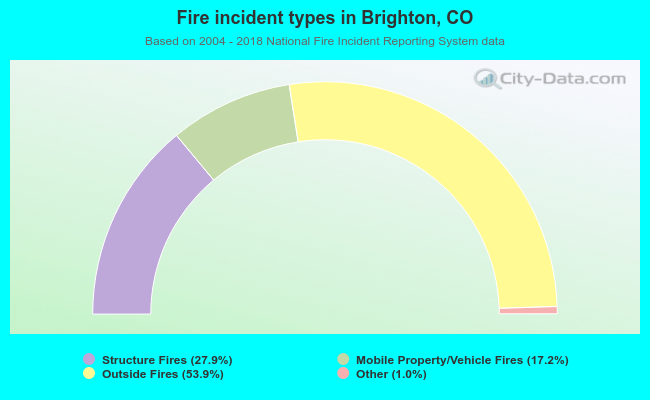 When looking into fire subcategories, the most incidents belonged to: Outside Fires (53.9%), and Structure Fires (27.9%).