Broomfield: Fire Incidents, Colorado (CO)
Where are fire incidents reported in Broomfield, CO
Something went wrong! Please refresh the page.
| Fire incidents reported | |
|---|---|
| Sreet name | Count |
| MIDWAY BLVD | 138 |
| 120TH AVE | 128 |
| ZUNI ST | 114 |
| SHERIDAN BLVD | 92 |
| 10TH AVE | 74 |
| I25 SB HWY | 72 |
| HWY 36 HWY | 66 |
| SUMMIT BLVD | 64 |
| 1ST AVE | 62 |
| 136TH AVE | 58 |
| 144TH AVE | 58 |
| I25 NB HWY | 56 |
| ALTER ST | 48 |
| PERRY ST | 44 |
| TRANSIT WAY | 40 |
| FLATIRON BLVD | 36 |
| LOWELL BLVD | 34 |
| FLATIRON CROSSING DR | 32 |
| WADSWORTH BLVD | 32 |
| HWY 287 HWY | 30 |
| I25 HWY | 28 |
| DILLON RD | 26 |
| HURON ST | 26 |
| INDUSTRIAL LN | 26 |
| MARBLE ST | 26 |
| WESTBOUND HWY 36 | 26 |
| 135TH AVE | 24 |
| AIRPORT WAY | 22 |
| DAPHNE ST | 22 |
| GARDEN CTR | 22 |
| Other | 274 |
2003 - 2018 National Fire Incident Reporting System (NFIRS) incidents
- Incident types reported to NFIRS in Broomfield, CO
- 17,20259.0%Rescue & EMS
- 2,9009.9%Service Call
- 2,6229.0%Hazardous Condition
- 2,3548.1%Good Intent Call
- 2,2397.7%False Alarm
- 1,8006.2%Fire
- Fire incident types reported to NFIRS in Broomfield, CO
- 70339.1%Structure Fires
- 68337.9%Outside Fires
- 33418.6%Mobile Property/Vehicle Fires
- 804.4%Other
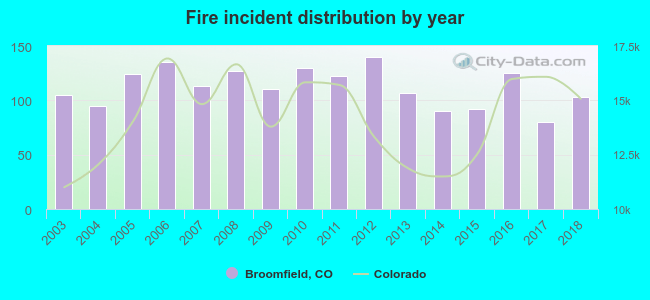 According to the data from the years 2003 - 2018 the average number of fire incidents per year is 112. The highest number of fires - 140 took place in 2012, and the least - 80 in 2017. The data has a dropping trend.
The average number of yearly fire incidents per 10k residents in Broomfield, CO compared to nearest cities:
(Note: Based on data for the last 3 years, including only cities with population 5,000 and above)
| Broomfield: | 16.5 |
| Westminster: | 19.6 |
| Lafayette: | 23.8 |
| Northglenn: | 25.4 |
| Superior: | 9.3 |
| Louisville: | 17.1 |
| Federal Heights: | 36.4 |
| Thornton: | 21.3 |
| Erie: | 26.0 |
 The median response time based on all reported fire incidents is 6 minutes. This is similar to the Colorado median value.
The median response time in Broomfield, CO compared to nearest cities:
(Note: Based on data for all years, including only cities with at least 500 fire incidents)
| Broomfield: | 6 minutes |
| Westminster: | 5 minutes |
| Lafayette: | 5 minutes |
| Northglenn: | 6 minutes |
| Federal Heights: | 5 minutes |
| Thornton: | 7 minutes |
| Erie: | 7 minutes |
| Arvada: | 5 minutes |
| Commerce City: | 5 minutes |
 According to the reports from the years 2003 - 2018 the average number of fire-related yearly casualties is 1. The highest number of reported casualties - 5 took place in 2011, and the lowest - 0 in 2003. The data has a constant trend.
The average number of injuries per 1,000 fires is 12. This indicator was the highest - 41 in 2011, and the lowest 0 in 2003. The trend for injuries per 1,000 fire incidents is constant. Compared to the Colorado value the number of injuries per 1,000 fire incidents is about the same.
According to the reports from the years 2003 - 2018 the average number of fire-related yearly casualties is 1. The highest number of reported casualties - 5 took place in 2011, and the lowest - 0 in 2003. The data has a constant trend.
The average number of injuries per 1,000 fires is 12. This indicator was the highest - 41 in 2011, and the lowest 0 in 2003. The trend for injuries per 1,000 fire incidents is constant. Compared to the Colorado value the number of injuries per 1,000 fire incidents is about the same.Casualties per 1,000 incidents in Broomfield, CO compared to nearest cities:
(Note: Based on data for all years, including only cities with at least 500 fire incidents)
| Broomfield: | 11.7 |
| Westminster: | 34.0 |
| Lafayette: | 5.1 |
| Northglenn: | 9.4 |
| Federal Heights: | 21.2 |
| Thornton: | 13.9 |
| Erie: | 4.6 |
| Arvada: | 13.9 |
| Commerce City: | 12.1 |
 29.1% incidents where reported in the morning and 70.9% in the evening. The most fires (15.6%) took place on Saturday, and the least (13.1%) on Tuesday.
 According to the 1,800 fires from years 2003 - 2018 most fires (11.3%) took place during June, and the least (6.0%) in November.
 Out of all 29,164 cases reported during the years 2003 - 2018, the most belonged to the categories: Rescue & EMS (59.0%), Service Call (9.9%), and Hazardous Condition (9.0%).
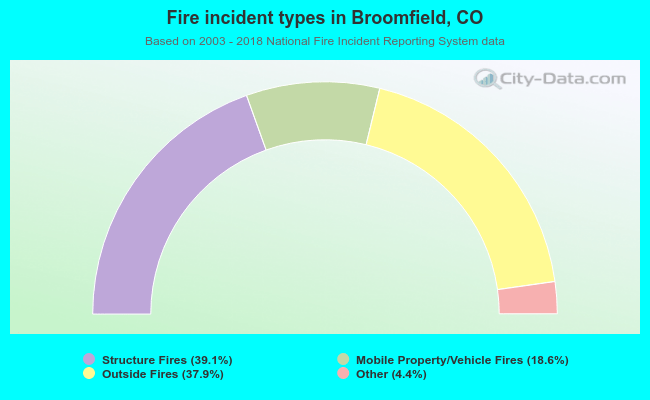 When looking into fire subcategories, the most incidents belonged to: Structure Fires (39.1%), and Outside Fires (37.9%).